
Websites Analytics
Open in NocthinkModule: Tools · URL: /analytics · Responsible role: Event Officer / communications (analytics.view) · Also used by: Owner/Director (full: add and delete sites), General Affairs (read)
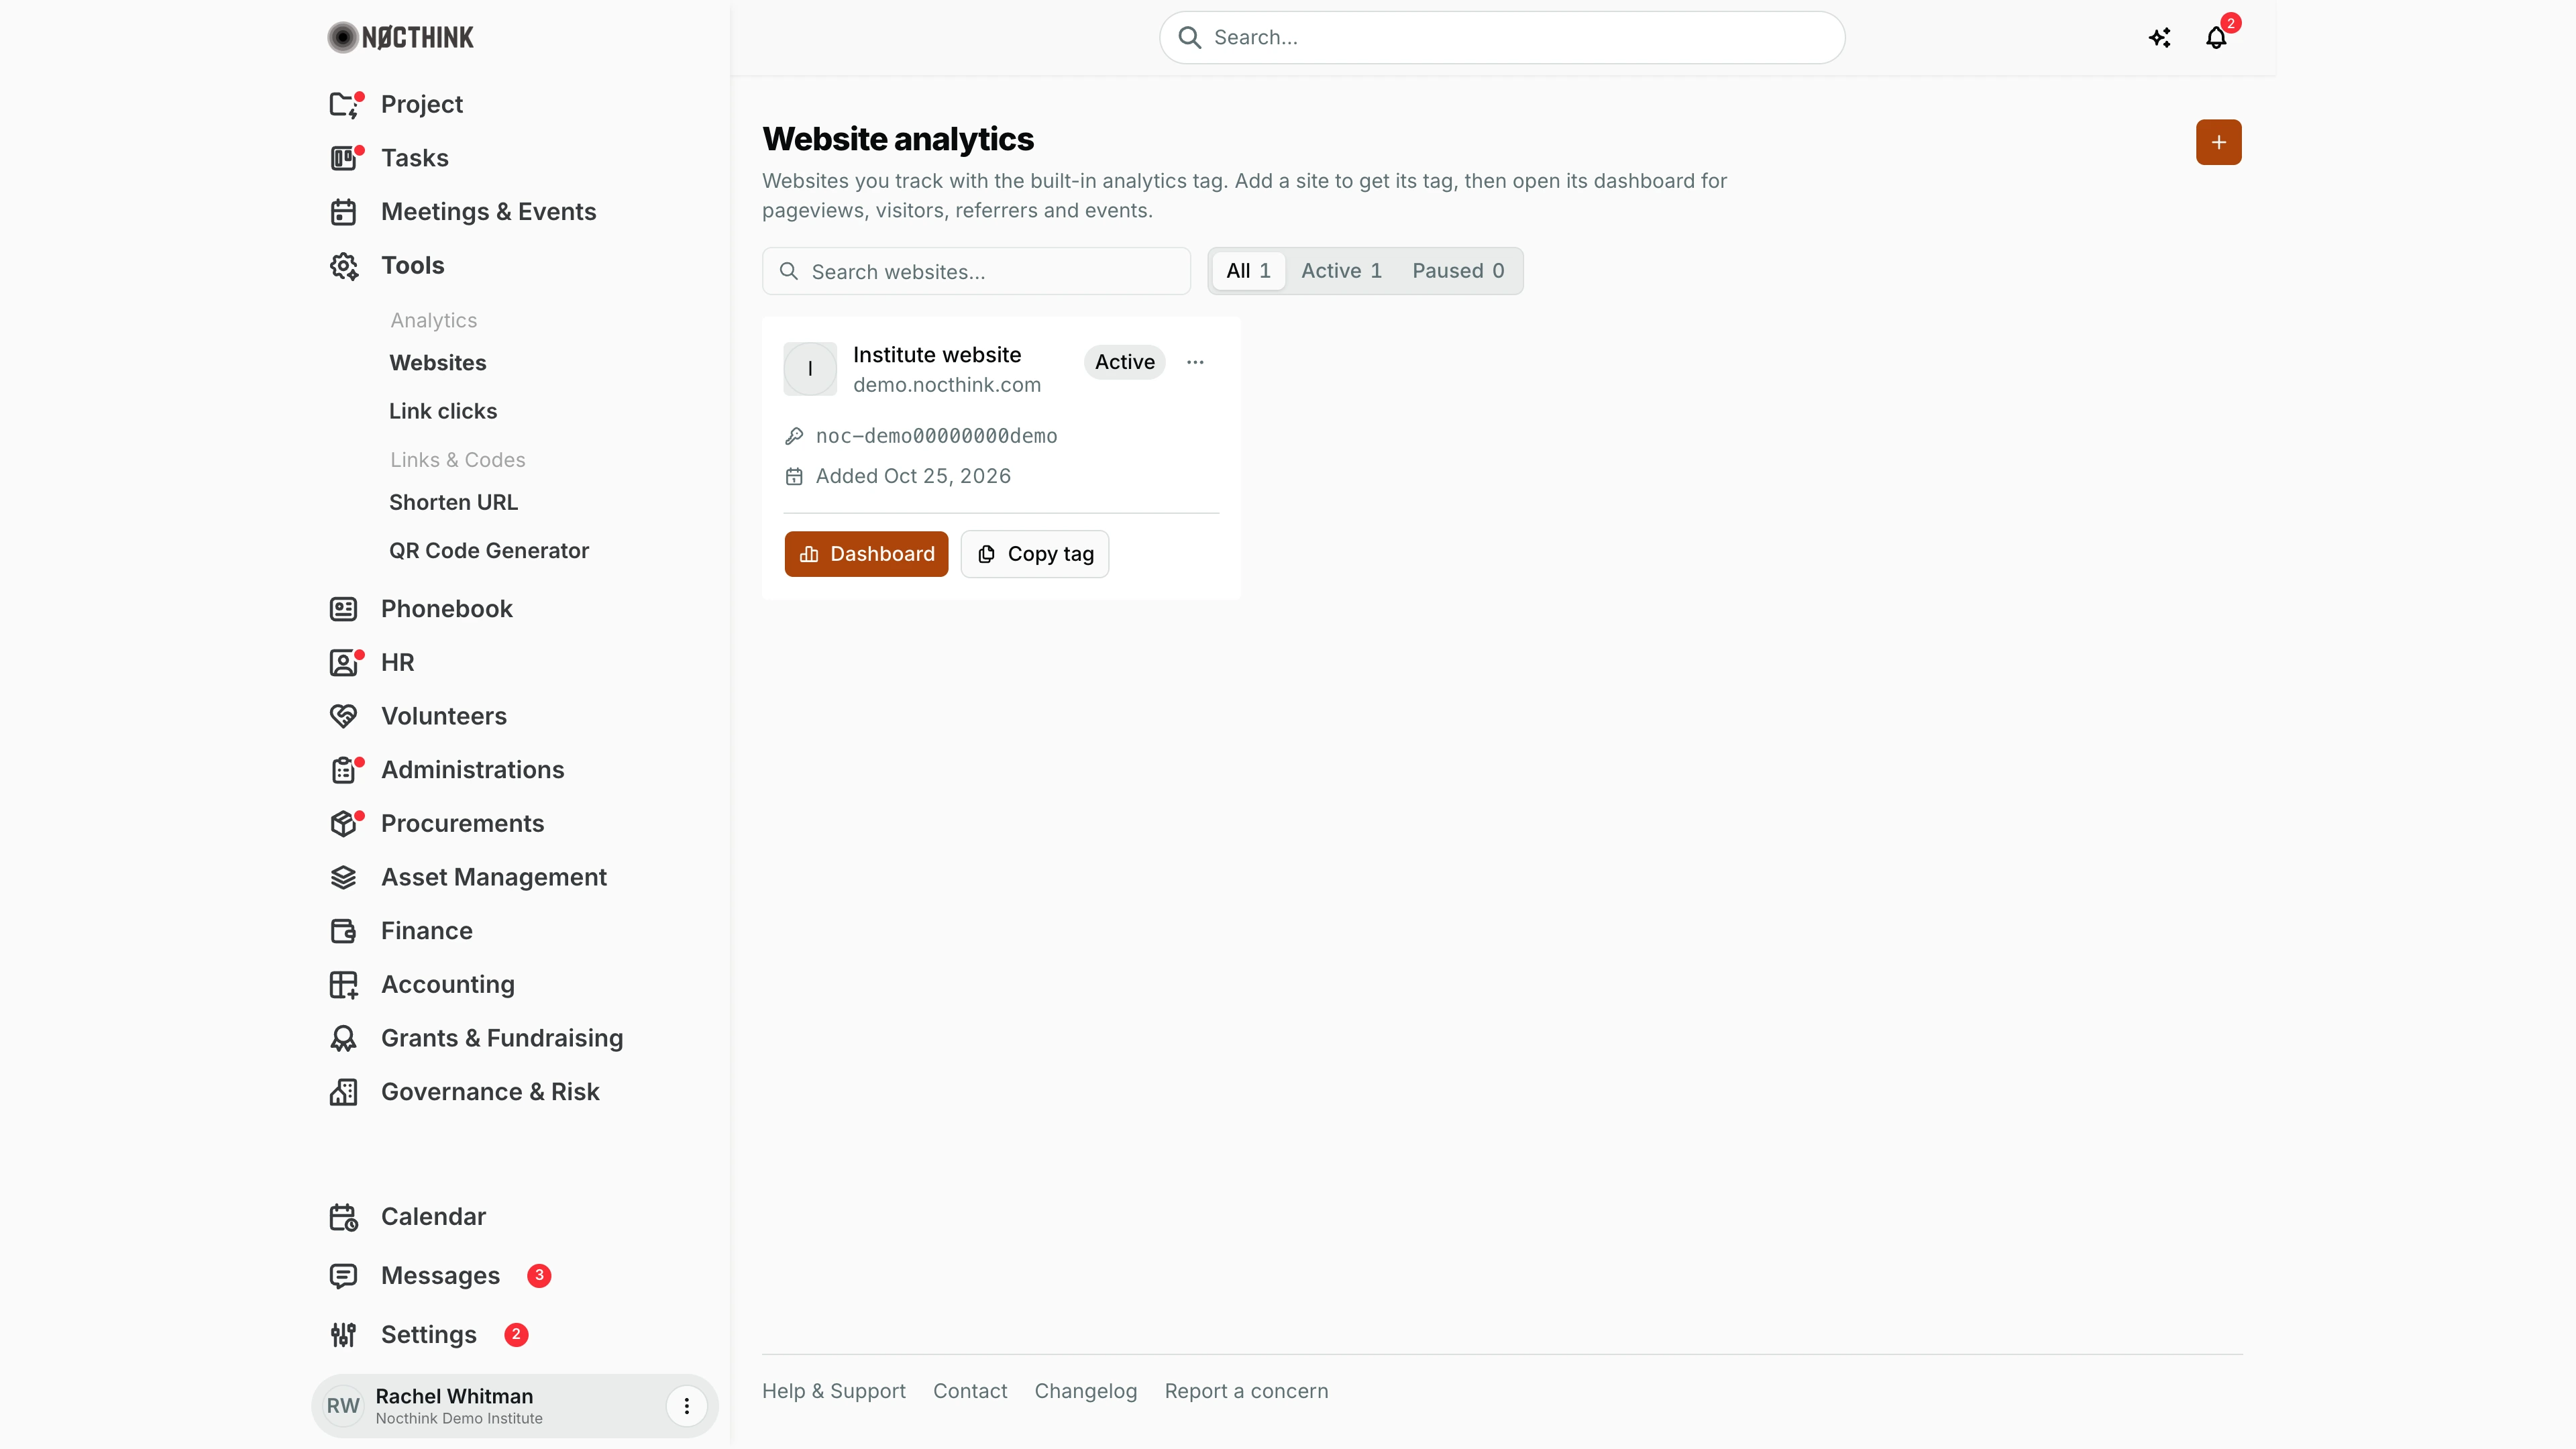
Screenshot: Rachel Whitman (Executive Director, organization owner), Nocthink Demo Institute demo data. An Event Officer sees the same page.
Why I use this page
This is where our own websites are tracked with the built-in analytics tag, without a third-party tool. I add a site once, paste its tag into the site's <head>, and from then on I open the site's dashboard to report pageviews, visitors, referrers and campaign results — typically after a newsletter, an event launch or a publication release, and in the monthly communications report.
What's on the screen
- Header — Website analytics with a short description and the orange + button (Add website) at the top right.
- Toolbar — Search websites… (matches name, domain and page title) and the status tabs All, Active, Paused, each with a count.
- Site cards — one per website: favicon or initial, name (links to the dashboard), domain, status badge (Active / Paused), the ⋯ menu, the public key (e.g.
noc-demo00000000demo), Added date, and the buttons Dashboard and Copy tag. - ⋯ menu — Open dashboard, Copy tracking tag, Refresh metadata, Delete site.
Opening a site (Dashboard) shows:
- Header — back link Website analytics, site name and domain, and the reporting-period picker (Today, Last 7 days, Last 30 days, Last 90 days, Year to date, Last 12 months, All time, or a custom date range).
- Stats — Pageviews, Unique visitors (with the top country and its share), Sessions, Pages per session, Bounce rate ("Sessions with 1 pageview"), Avg duration, Events.
- Tabs — Overview (Pageviews over time, Top pages, Referrers, …), Audience (Countries map, Devices, Browsers, Operating systems), Acquisition (Referrers, UTM source, UTM campaign), Pages and events (Top pages, Events), Install (the tracking snippet).
How I …
Add a website and install the tag
- Click + to open Add website (see Add website below).
- Enter Name (e.g. "Institute website") and Domain as a bare hostname, e.g.
example.org— nohttps://and no path. - Click Create. The new site card appears with its public key.
- Click Copy tag (or open the dashboard → Install tab → Copy).
- Ask the web developer to paste it before the closing
</head>tag on every page of the site. - After the first visits, open Dashboard and confirm Pageviews is above zero.
Report traffic for a period
- Click Dashboard on the site card (see Site dashboard: Overview below).
- Open the period picker at the top right and choose a preset or a custom range.
- Read the stat row, then use Overview for the trend and top pages, Audience for countries and devices, Acquisition for referrers and UTM campaigns.
Track a custom event (e.g. a sign-up)
- Open the site's Install tab (see Site dashboard: Install below).
- Give the developer the example call shown there:
nocthink('signup', { plan: 'pro' }). - After it goes live, check Events in the stat row and the Pages and events tab.
Remove a site
- Click ⋯ → Delete site on its card.
- Confirm "Delete "…"? All its analytics data is removed."
Detail page, forms & dialogs
Site dashboard: Overview
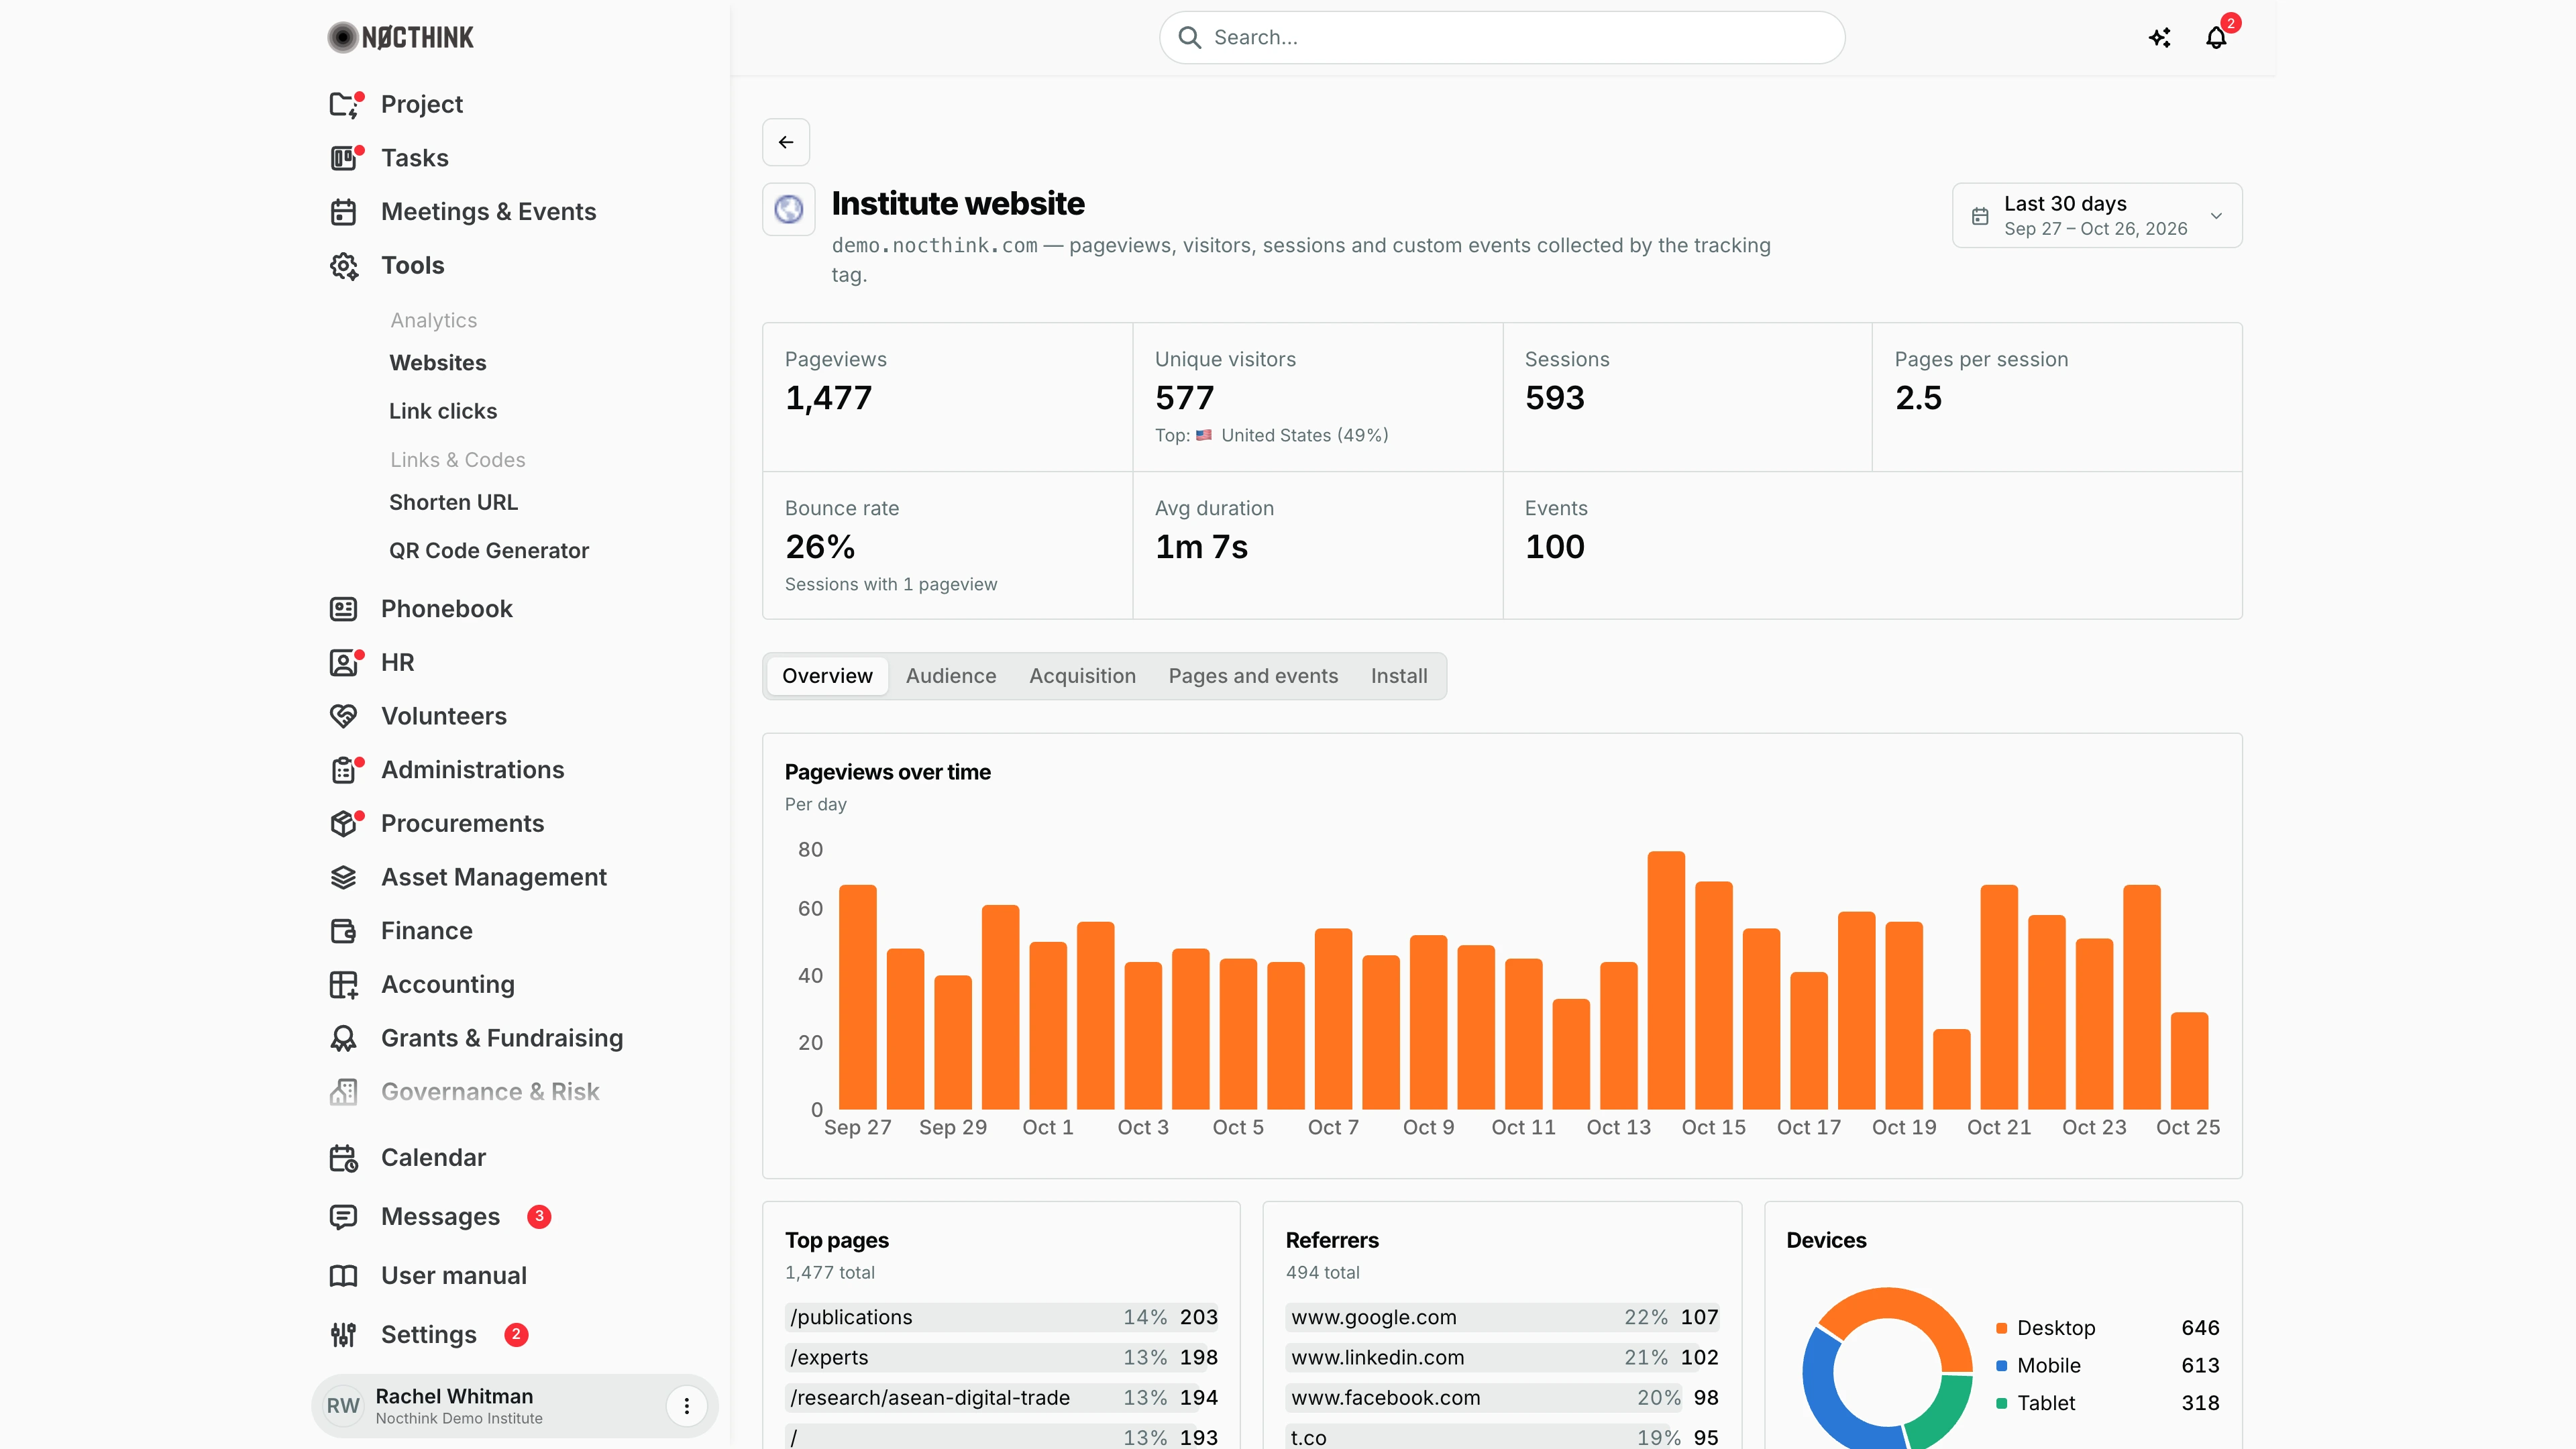
Screenshot: Rachel Whitman (Executive Director, organization owner), Nocthink Demo Institute demo data.
I open this with Dashboard on a site card or by clicking the site name. The header has the back link Website analytics, the site's name and domain, and the period picker at the top right; every number on the page follows the period I pick there. The stat row shows Pageviews, Unique visitors (with the top country and its share), Sessions, Pages per session, Bounce rate ("Sessions with 1 pageview"), Avg duration and Events. Overview is the tab the dashboard opens on. It charts Pageviews over time, per day, week or month depending on the length of the period, and lists Top pages, Referrers ("Direct only." when no visit came from another site) and Devices. This is the view I copy into the monthly communications report. The other four tabs break the same period down further.
Site dashboard: Audience
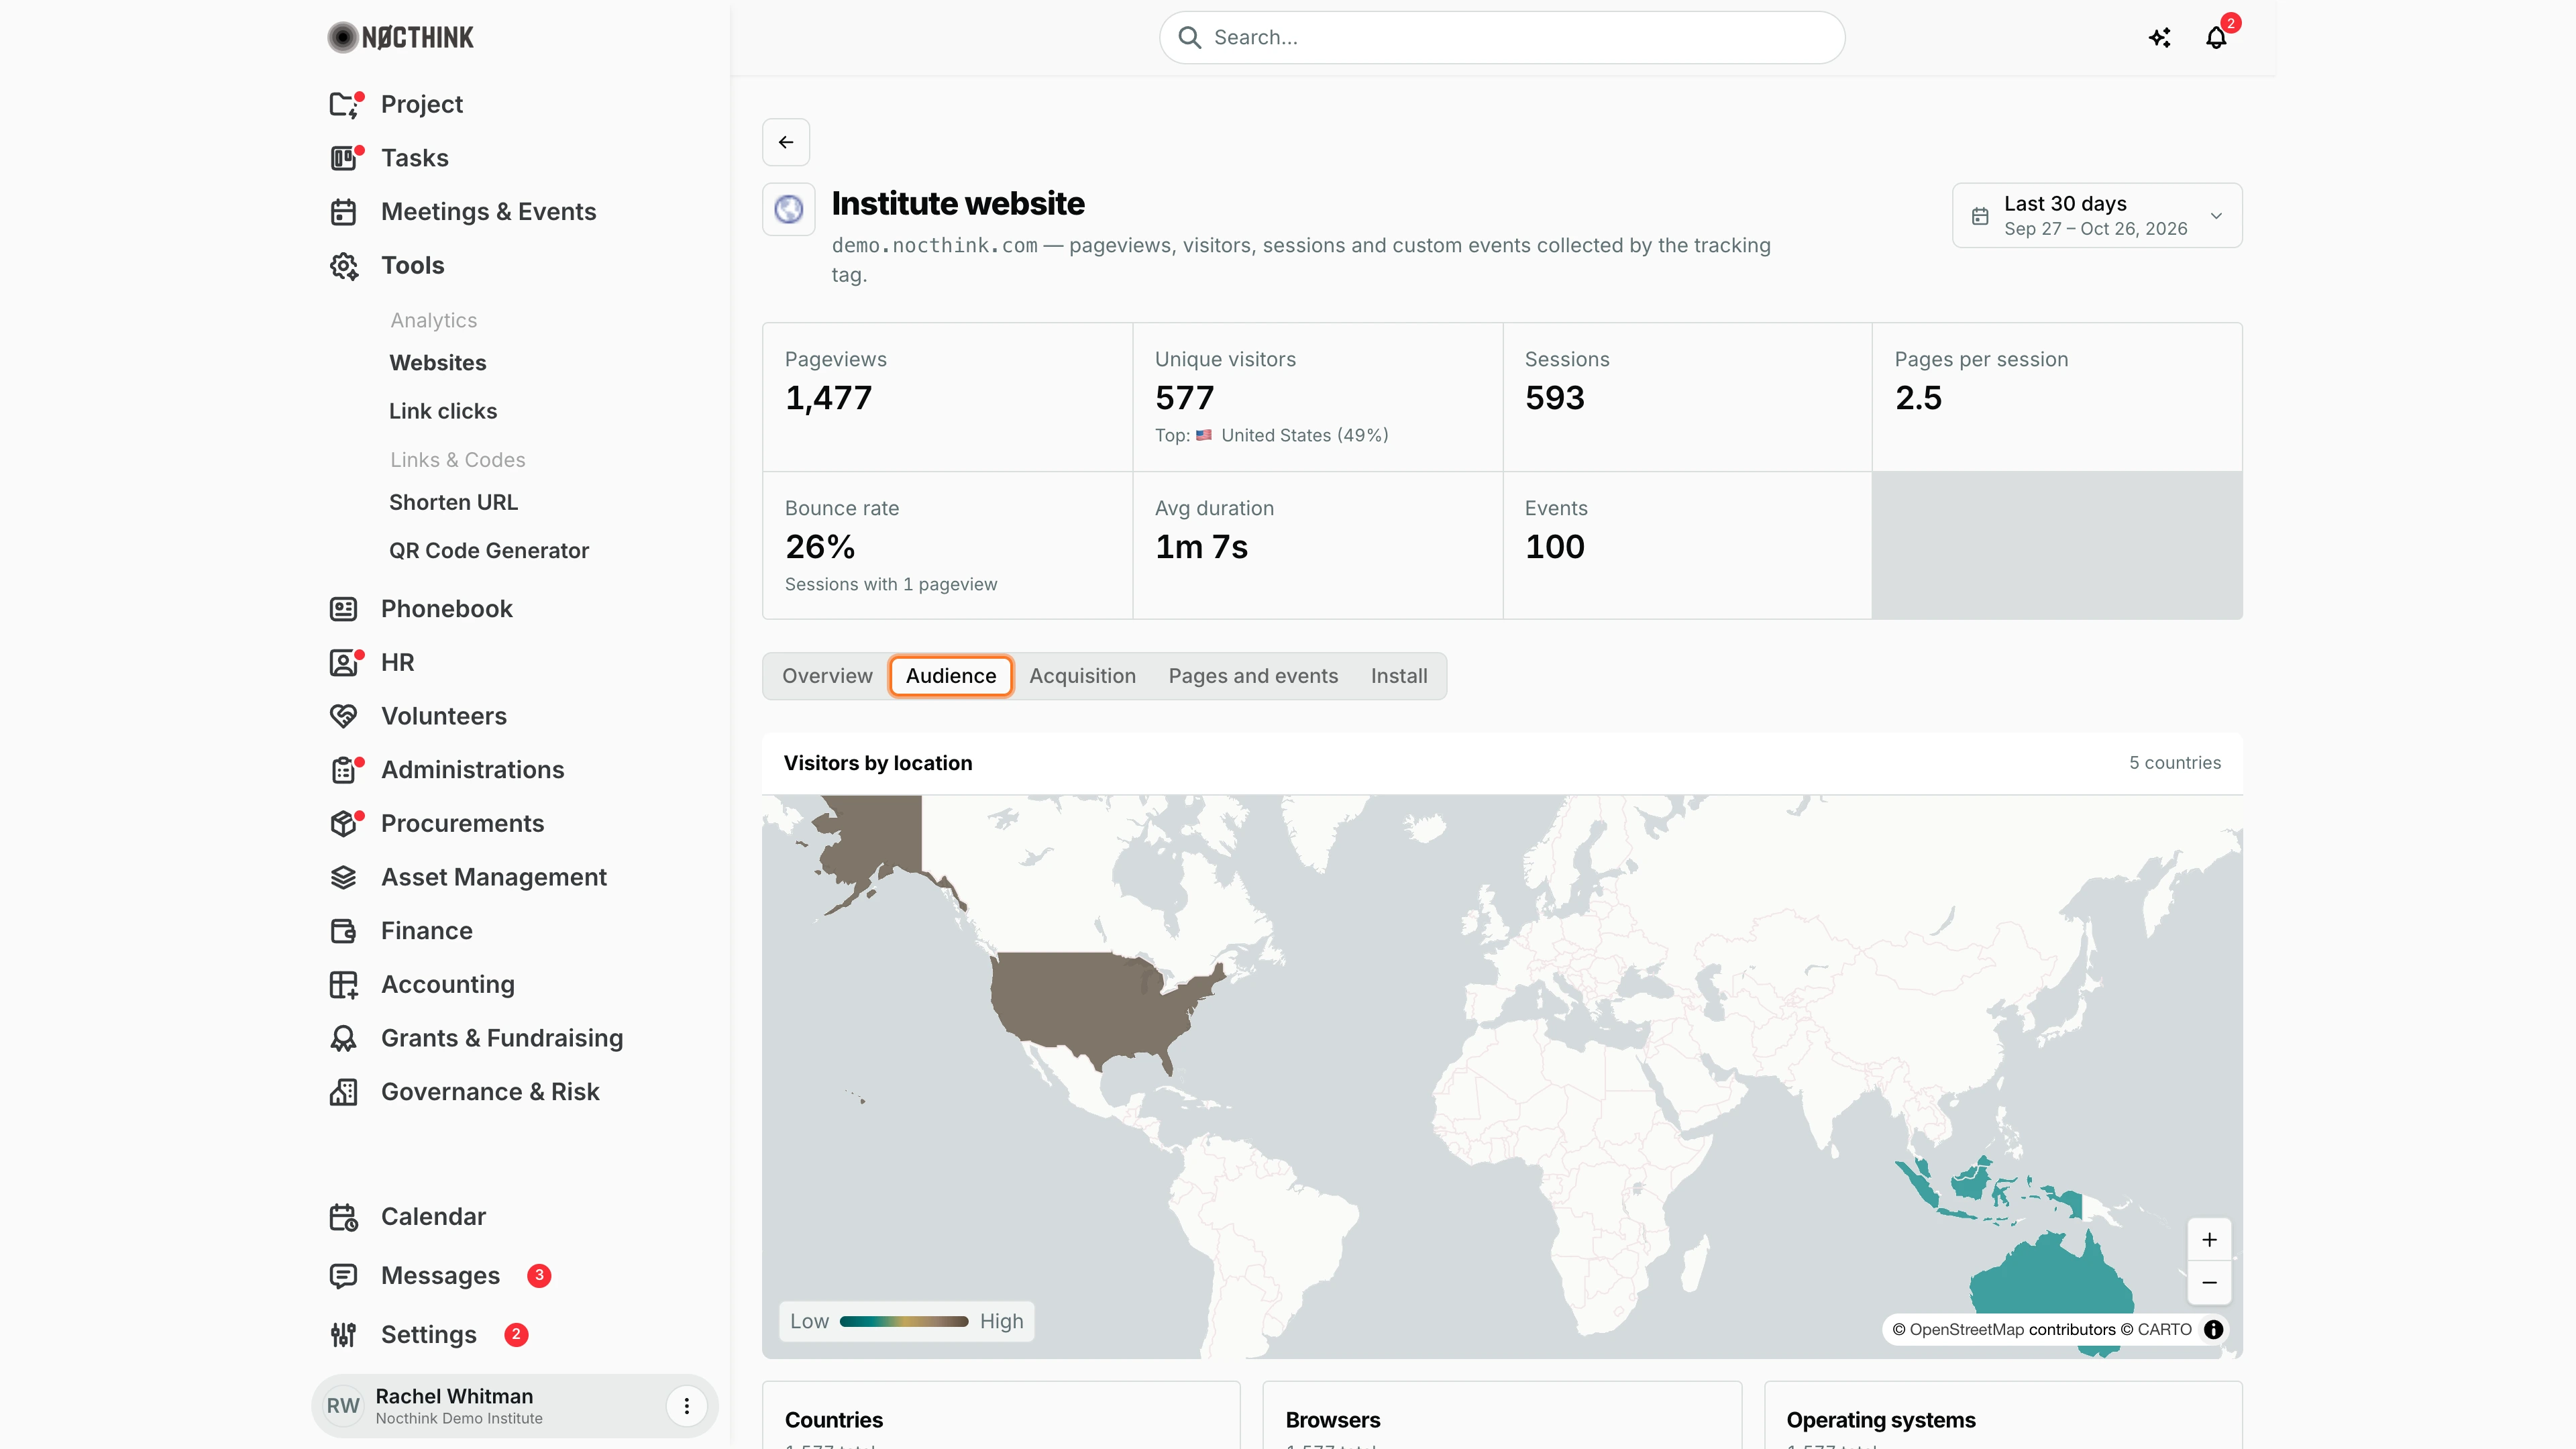
Screenshot: Rachel Whitman (Executive Director, organization owner), Nocthink Demo Institute demo data.
Audience answers "who visited". The top of the tab is a world map shaded by visitors per country. Below it are three ranked lists: Countries (shown by country name), Browsers and Operating systems. Each list counts visits in the period chosen in the header, so I change the period there rather than on the tab. I use this tab when a funder asks about our international reach, or to check that the Indonesian and U.S. audiences both show up after a launch. Nothing here can be edited; it is a read-only breakdown of the hits the tracking tag has collected.
Site dashboard: Acquisition
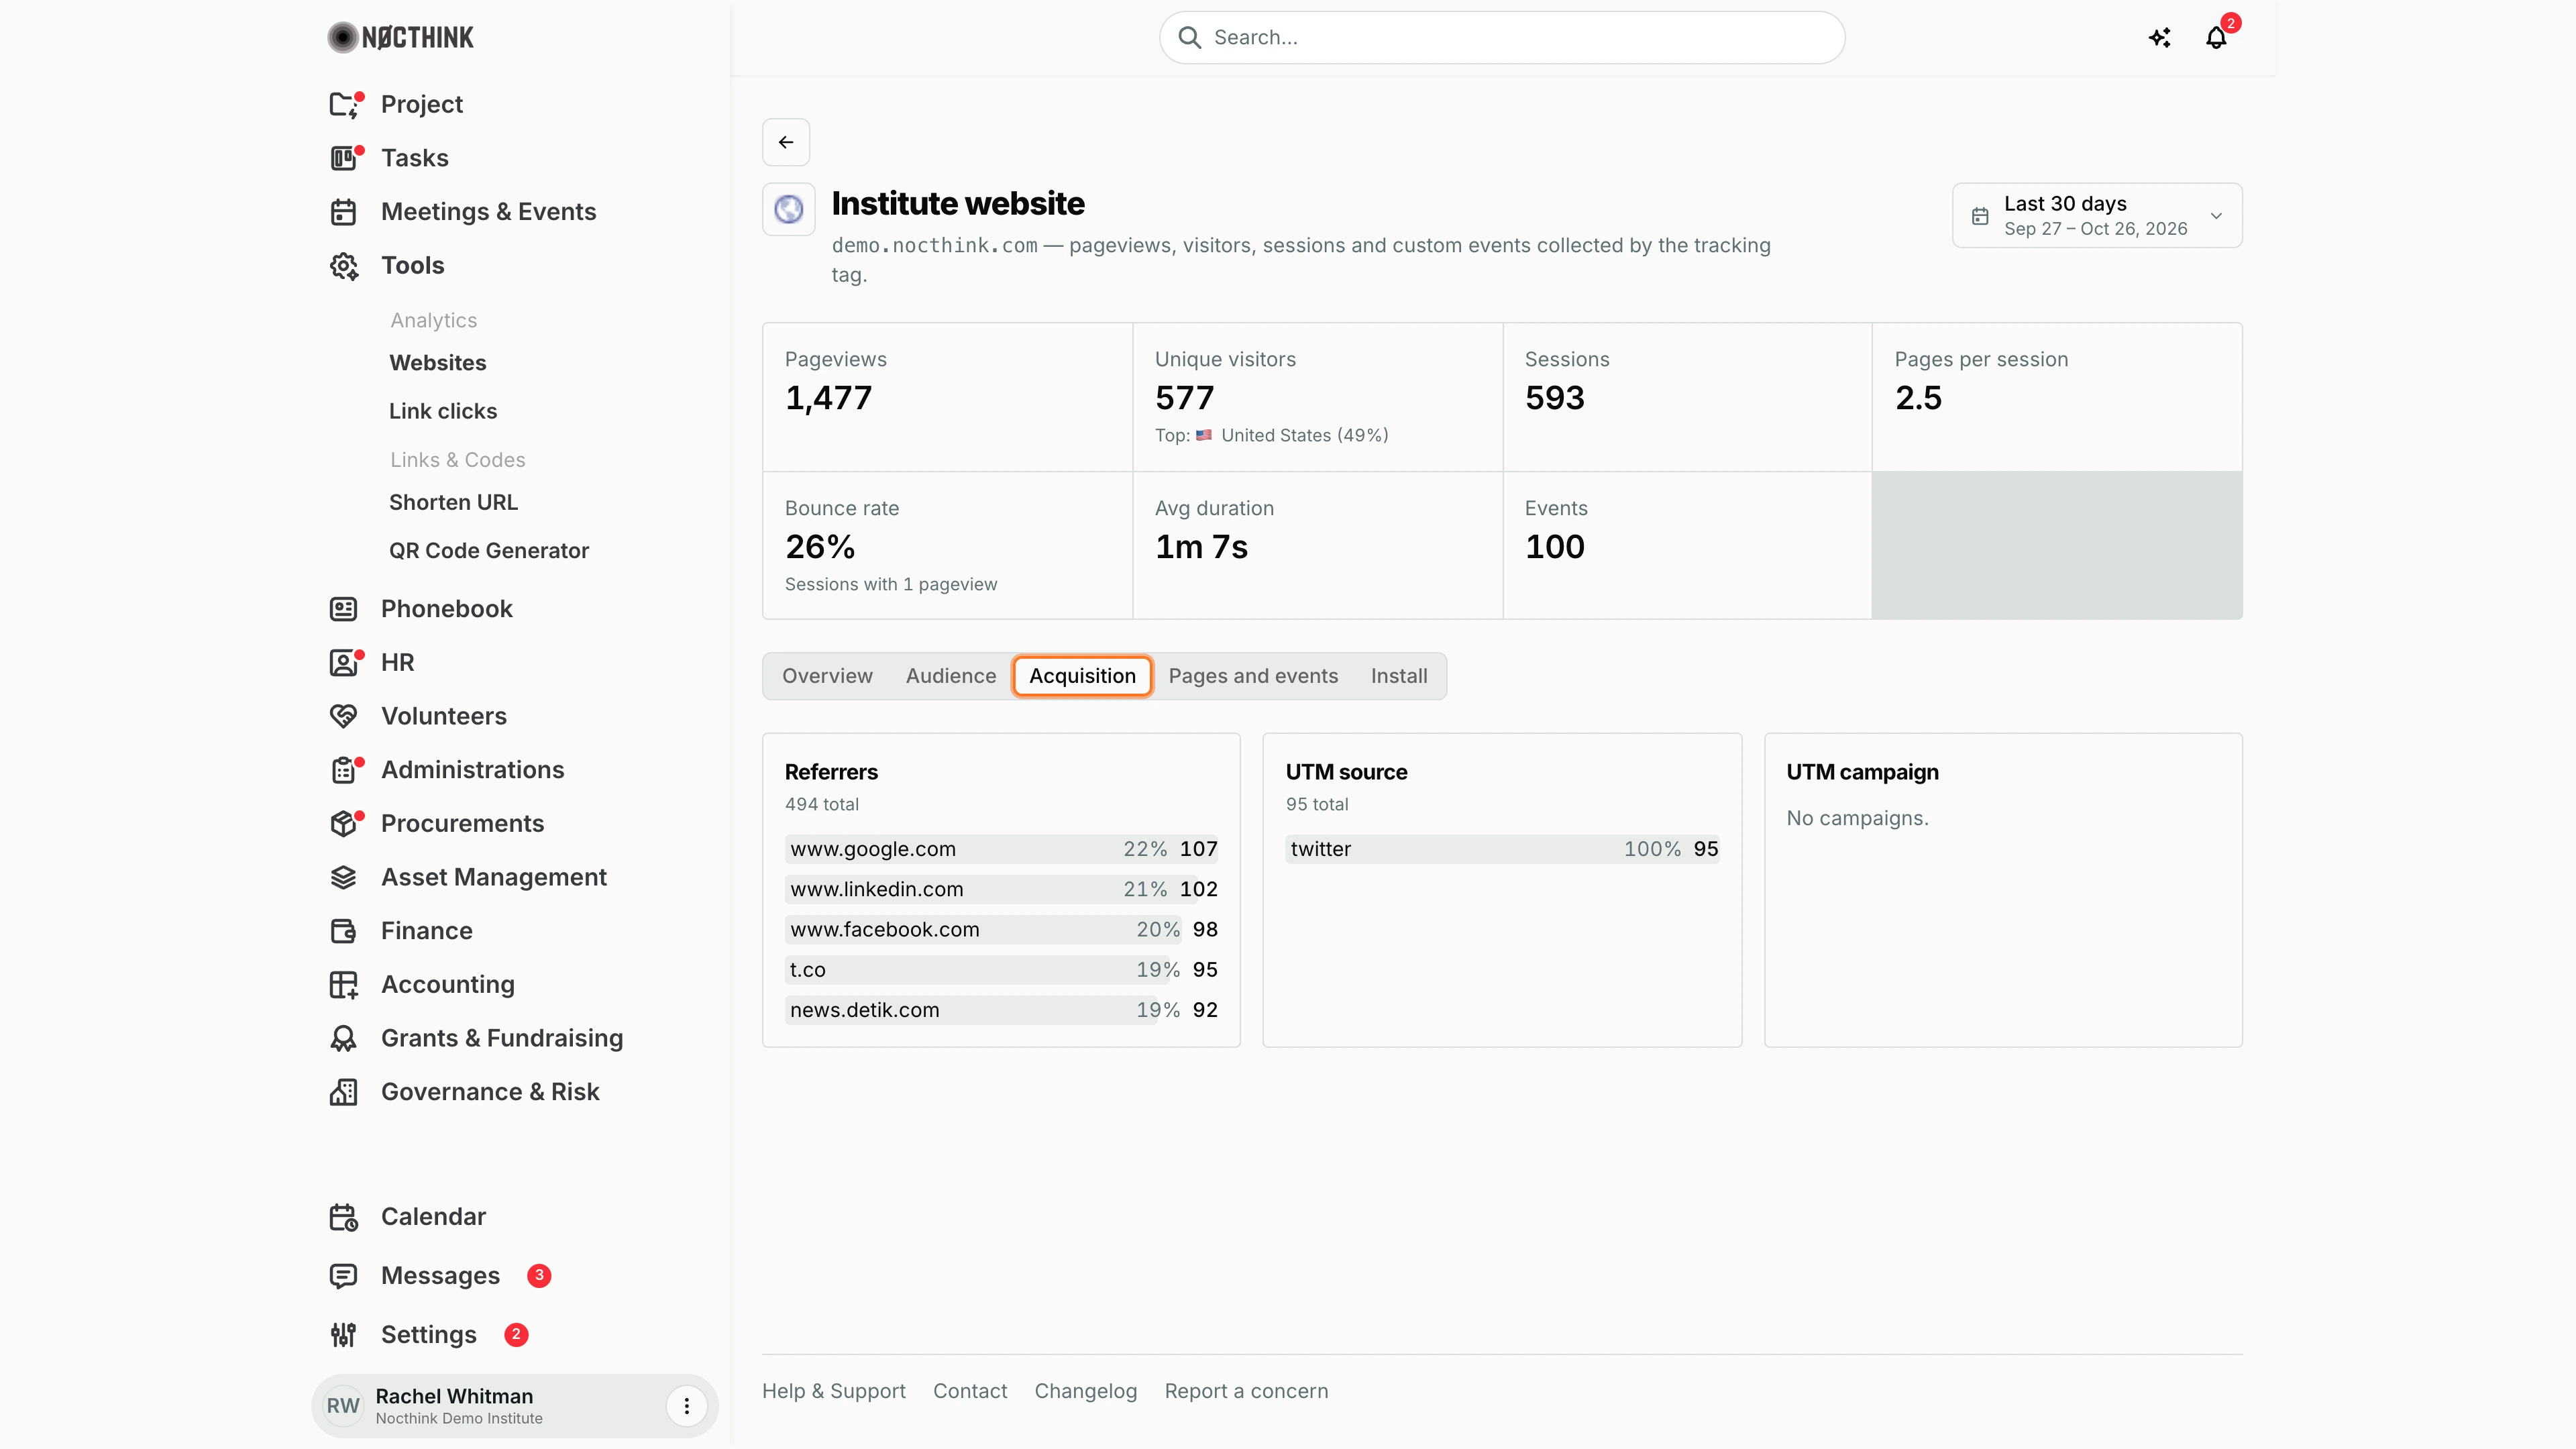
Screenshot: Rachel Whitman (Executive Director, organization owner), Nocthink Demo Institute demo data.
Acquisition answers "how they found us". It has three lists: Referrers (the other websites that sent visitors; "Direct only." when none did), UTM source and UTM campaign (both read "No campaigns." until a link carries utm_source or utm_campaign parameters). Before a newsletter or social post I add those parameters to the link, often as a Shorten URL link, and after it goes out I come here to see how many visits each campaign brought in for the period. A campaign that shows no visits here usually means the link lost its parameters on the way, for example through a redirect that drops the query string.
Site dashboard: Pages and events
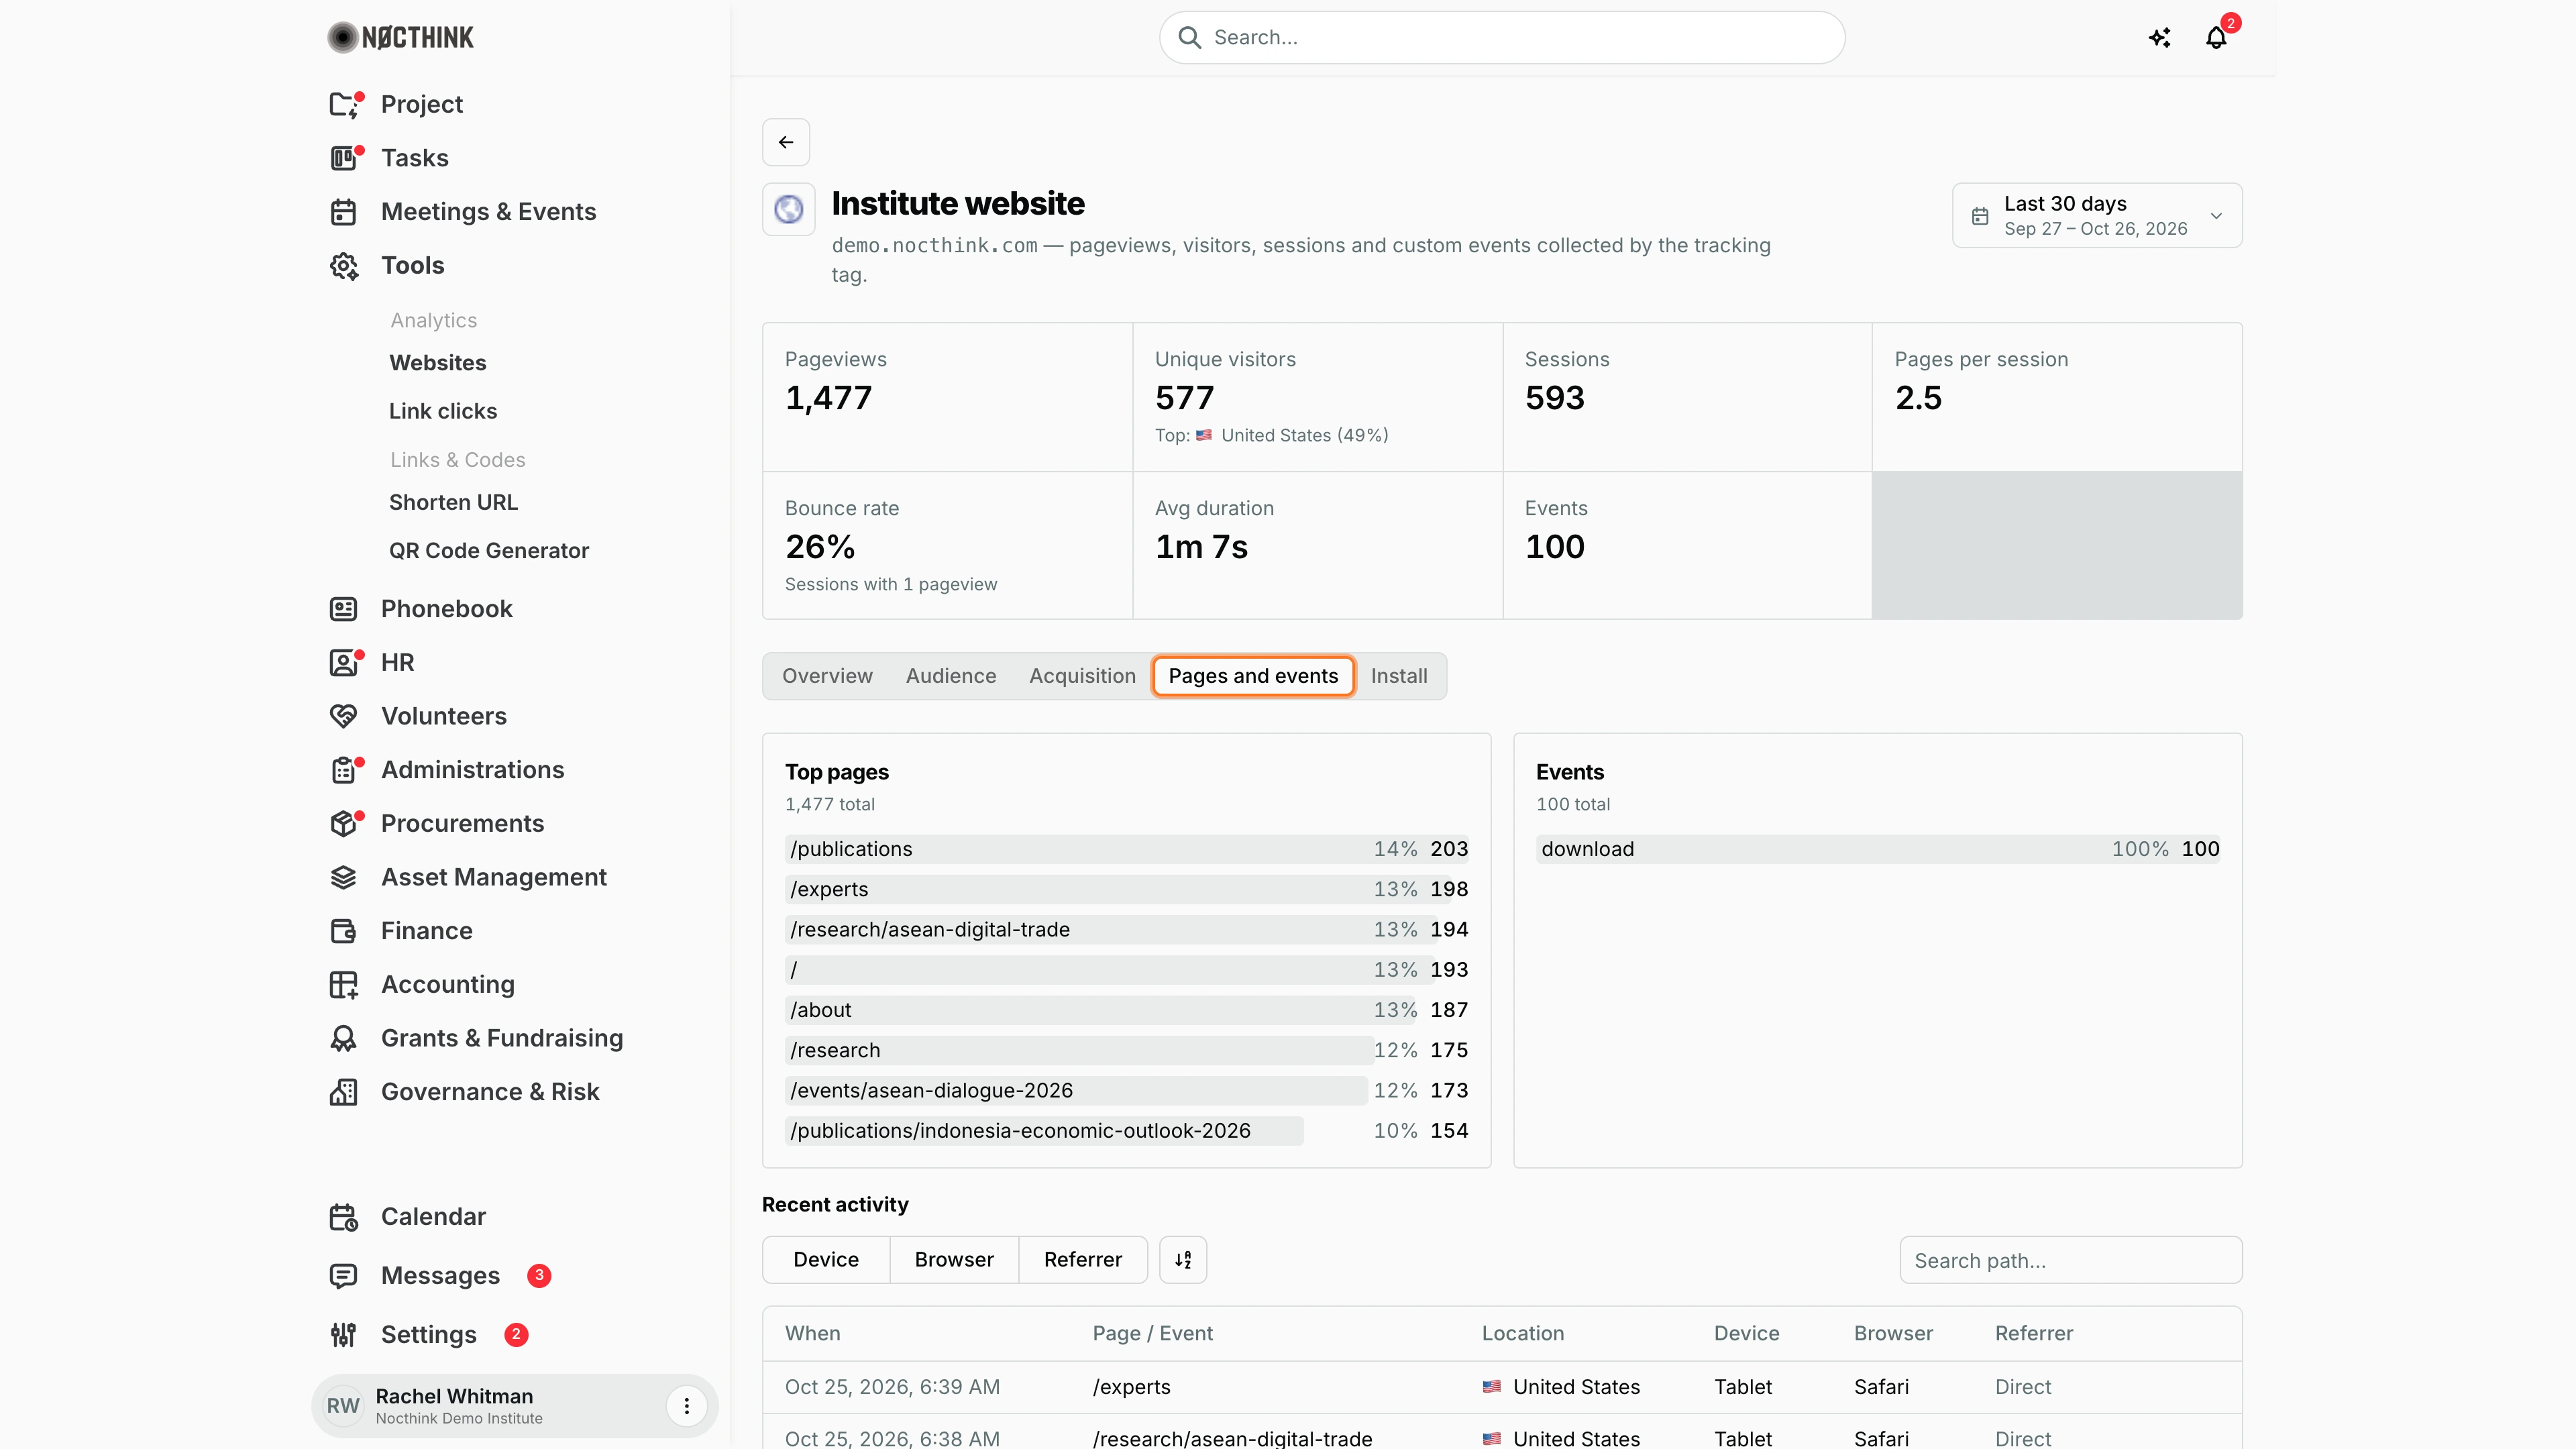
Screenshot: Rachel Whitman (Executive Director, organization owner), Nocthink Demo Institute demo data.
Pages and events shows what visitors did. Top pages ranks paths by pageviews, and Events ranks the custom events the site sends with nocthink('<name>', …) ("No custom events." until the developer adds one). Under them, Recent activity lists individual hits for the period with When, Page / Event, Location, Device, Browser and Referrer. I can search it with Search path…, filter it by Device, Browser or Referrer (including Direct), and page through it. This is where I check that a new sign-up event is actually arriving after the developer installs it.
Site dashboard: Install
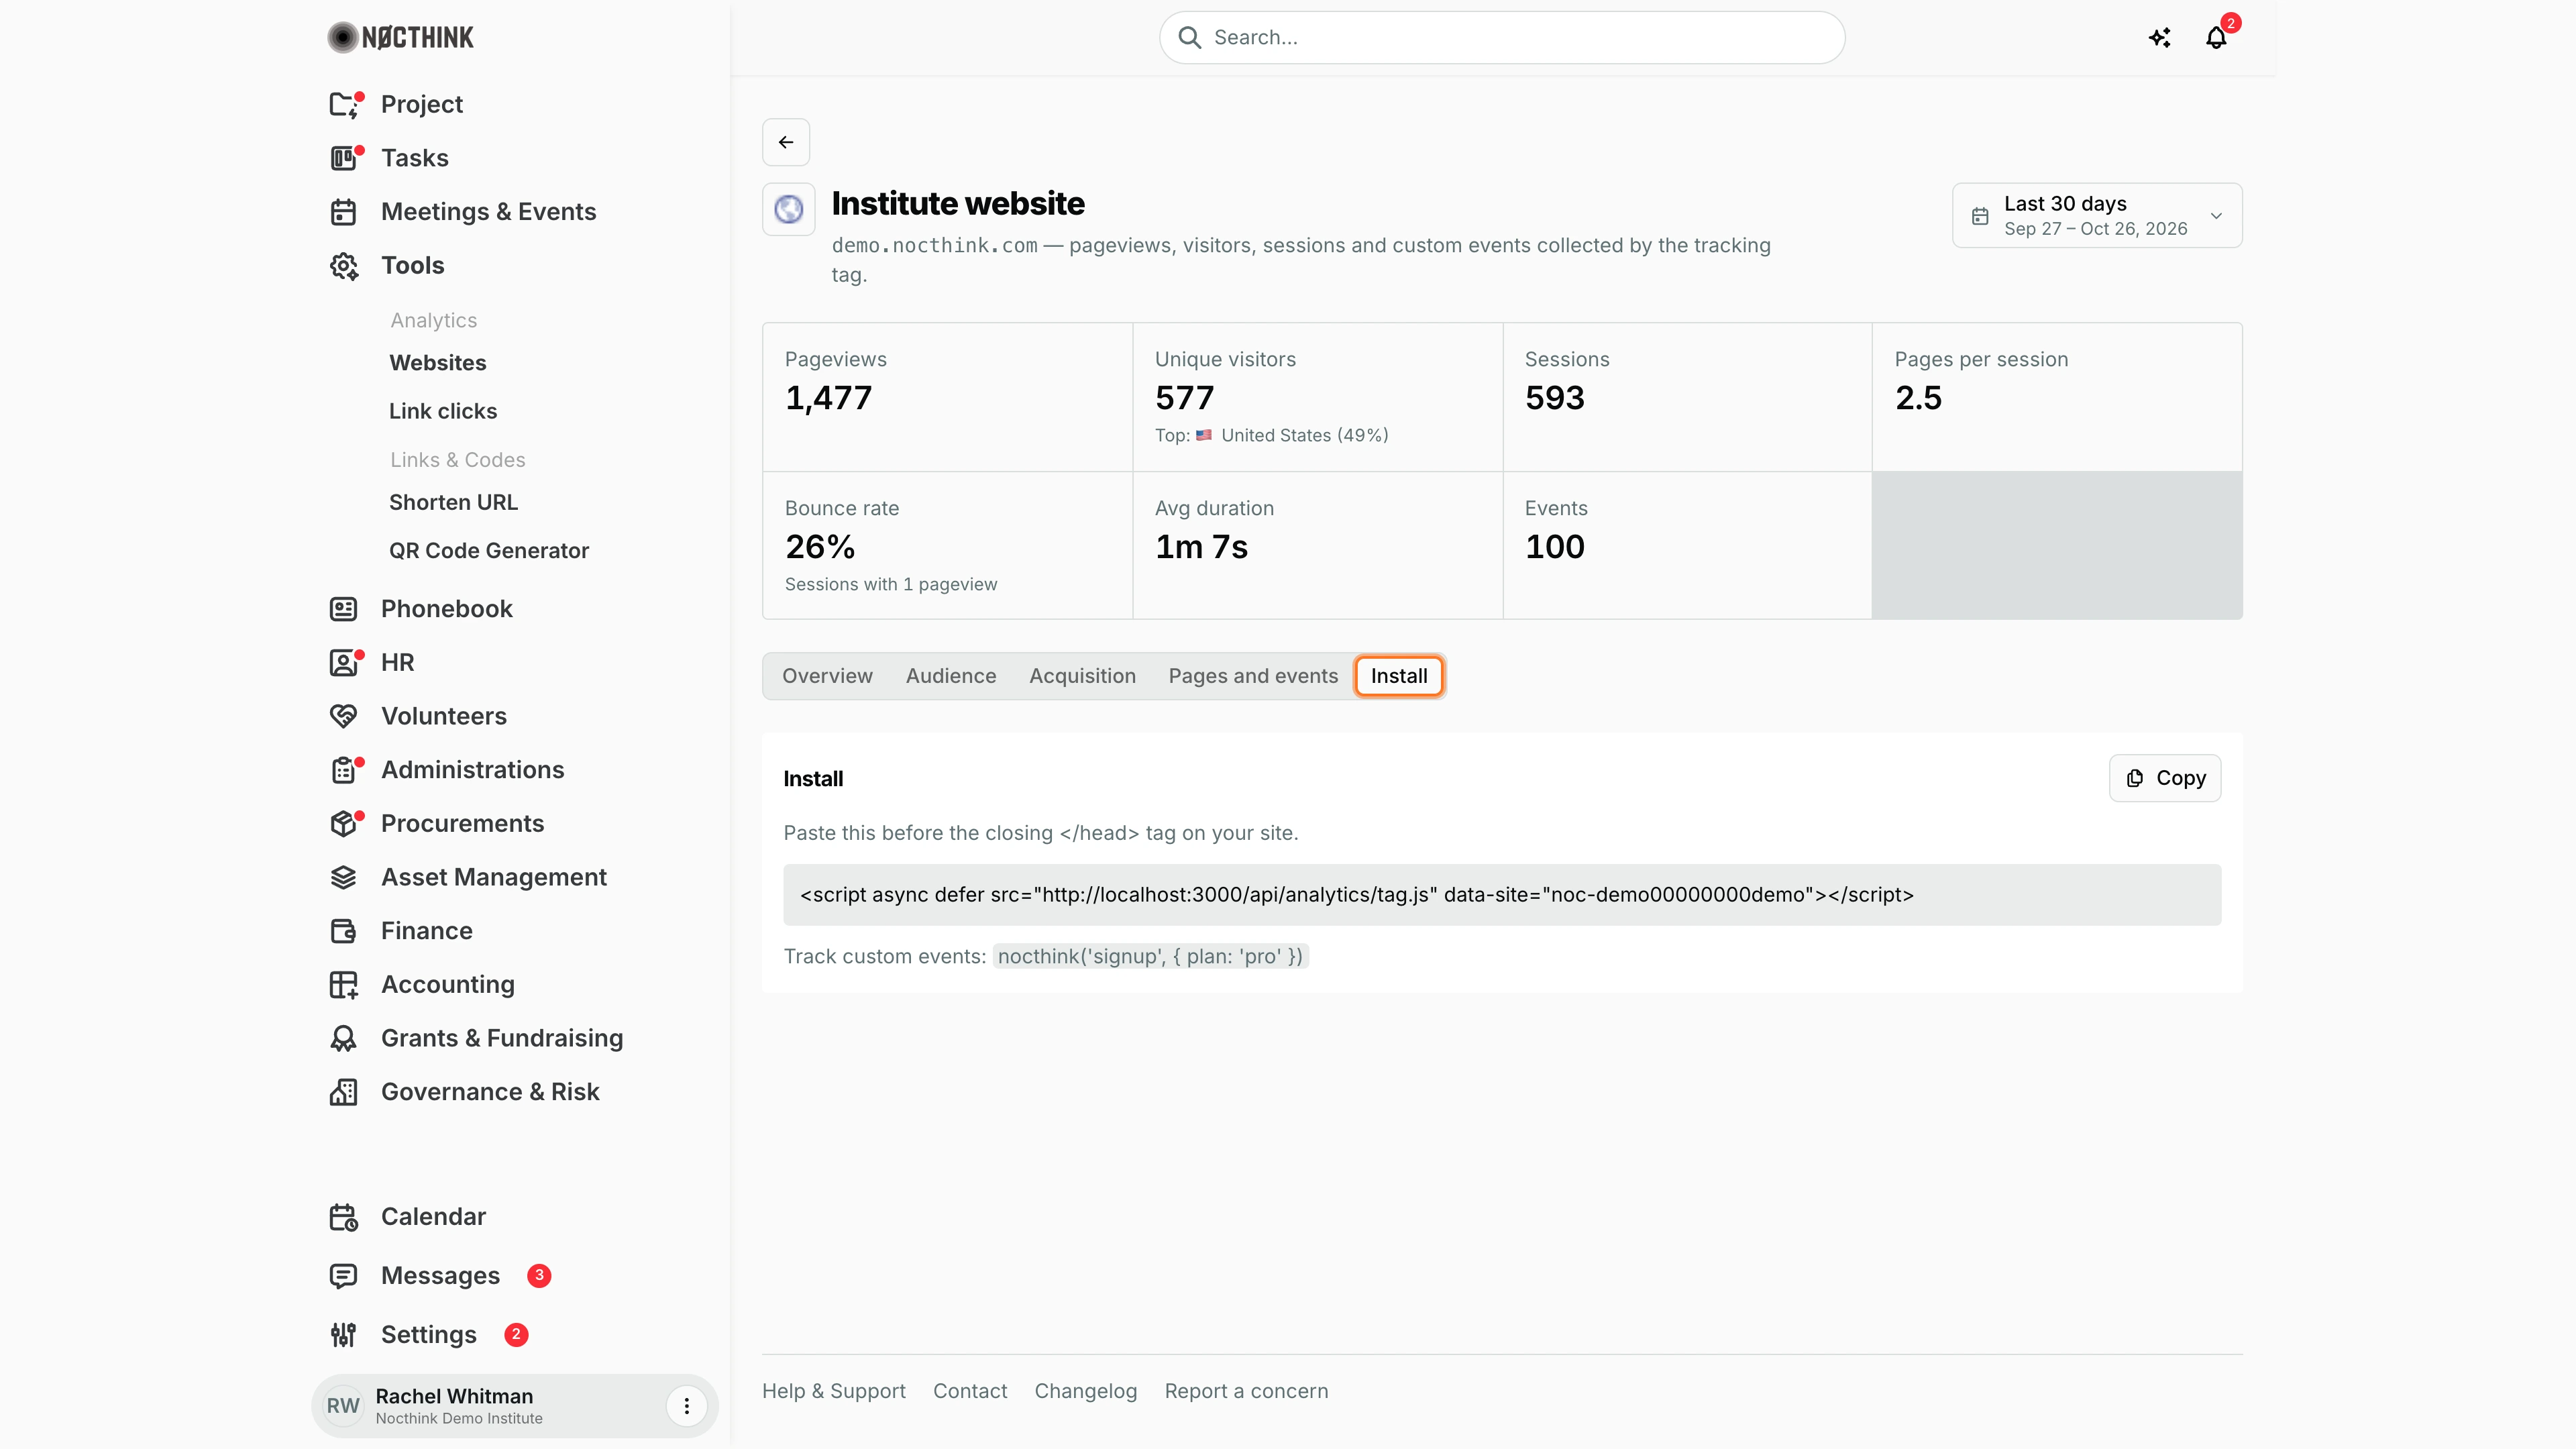
Screenshot: Rachel Whitman (Executive Director, organization owner), Nocthink Demo Institute demo data.
Install holds the site's tracking tag. The card says "Paste this before the closing </head> tag on your site." and shows the snippet with a Copy button (it reads Copied for a moment after a click). Below the snippet is the example call for a custom event, nocthink('signup', { plan: 'pro' }). I hand both to the web developer when a site is first added, or when a site is rebuilt and the tag has to go back in. It is the same snippet that Copy tag on the site card copies.
Add website
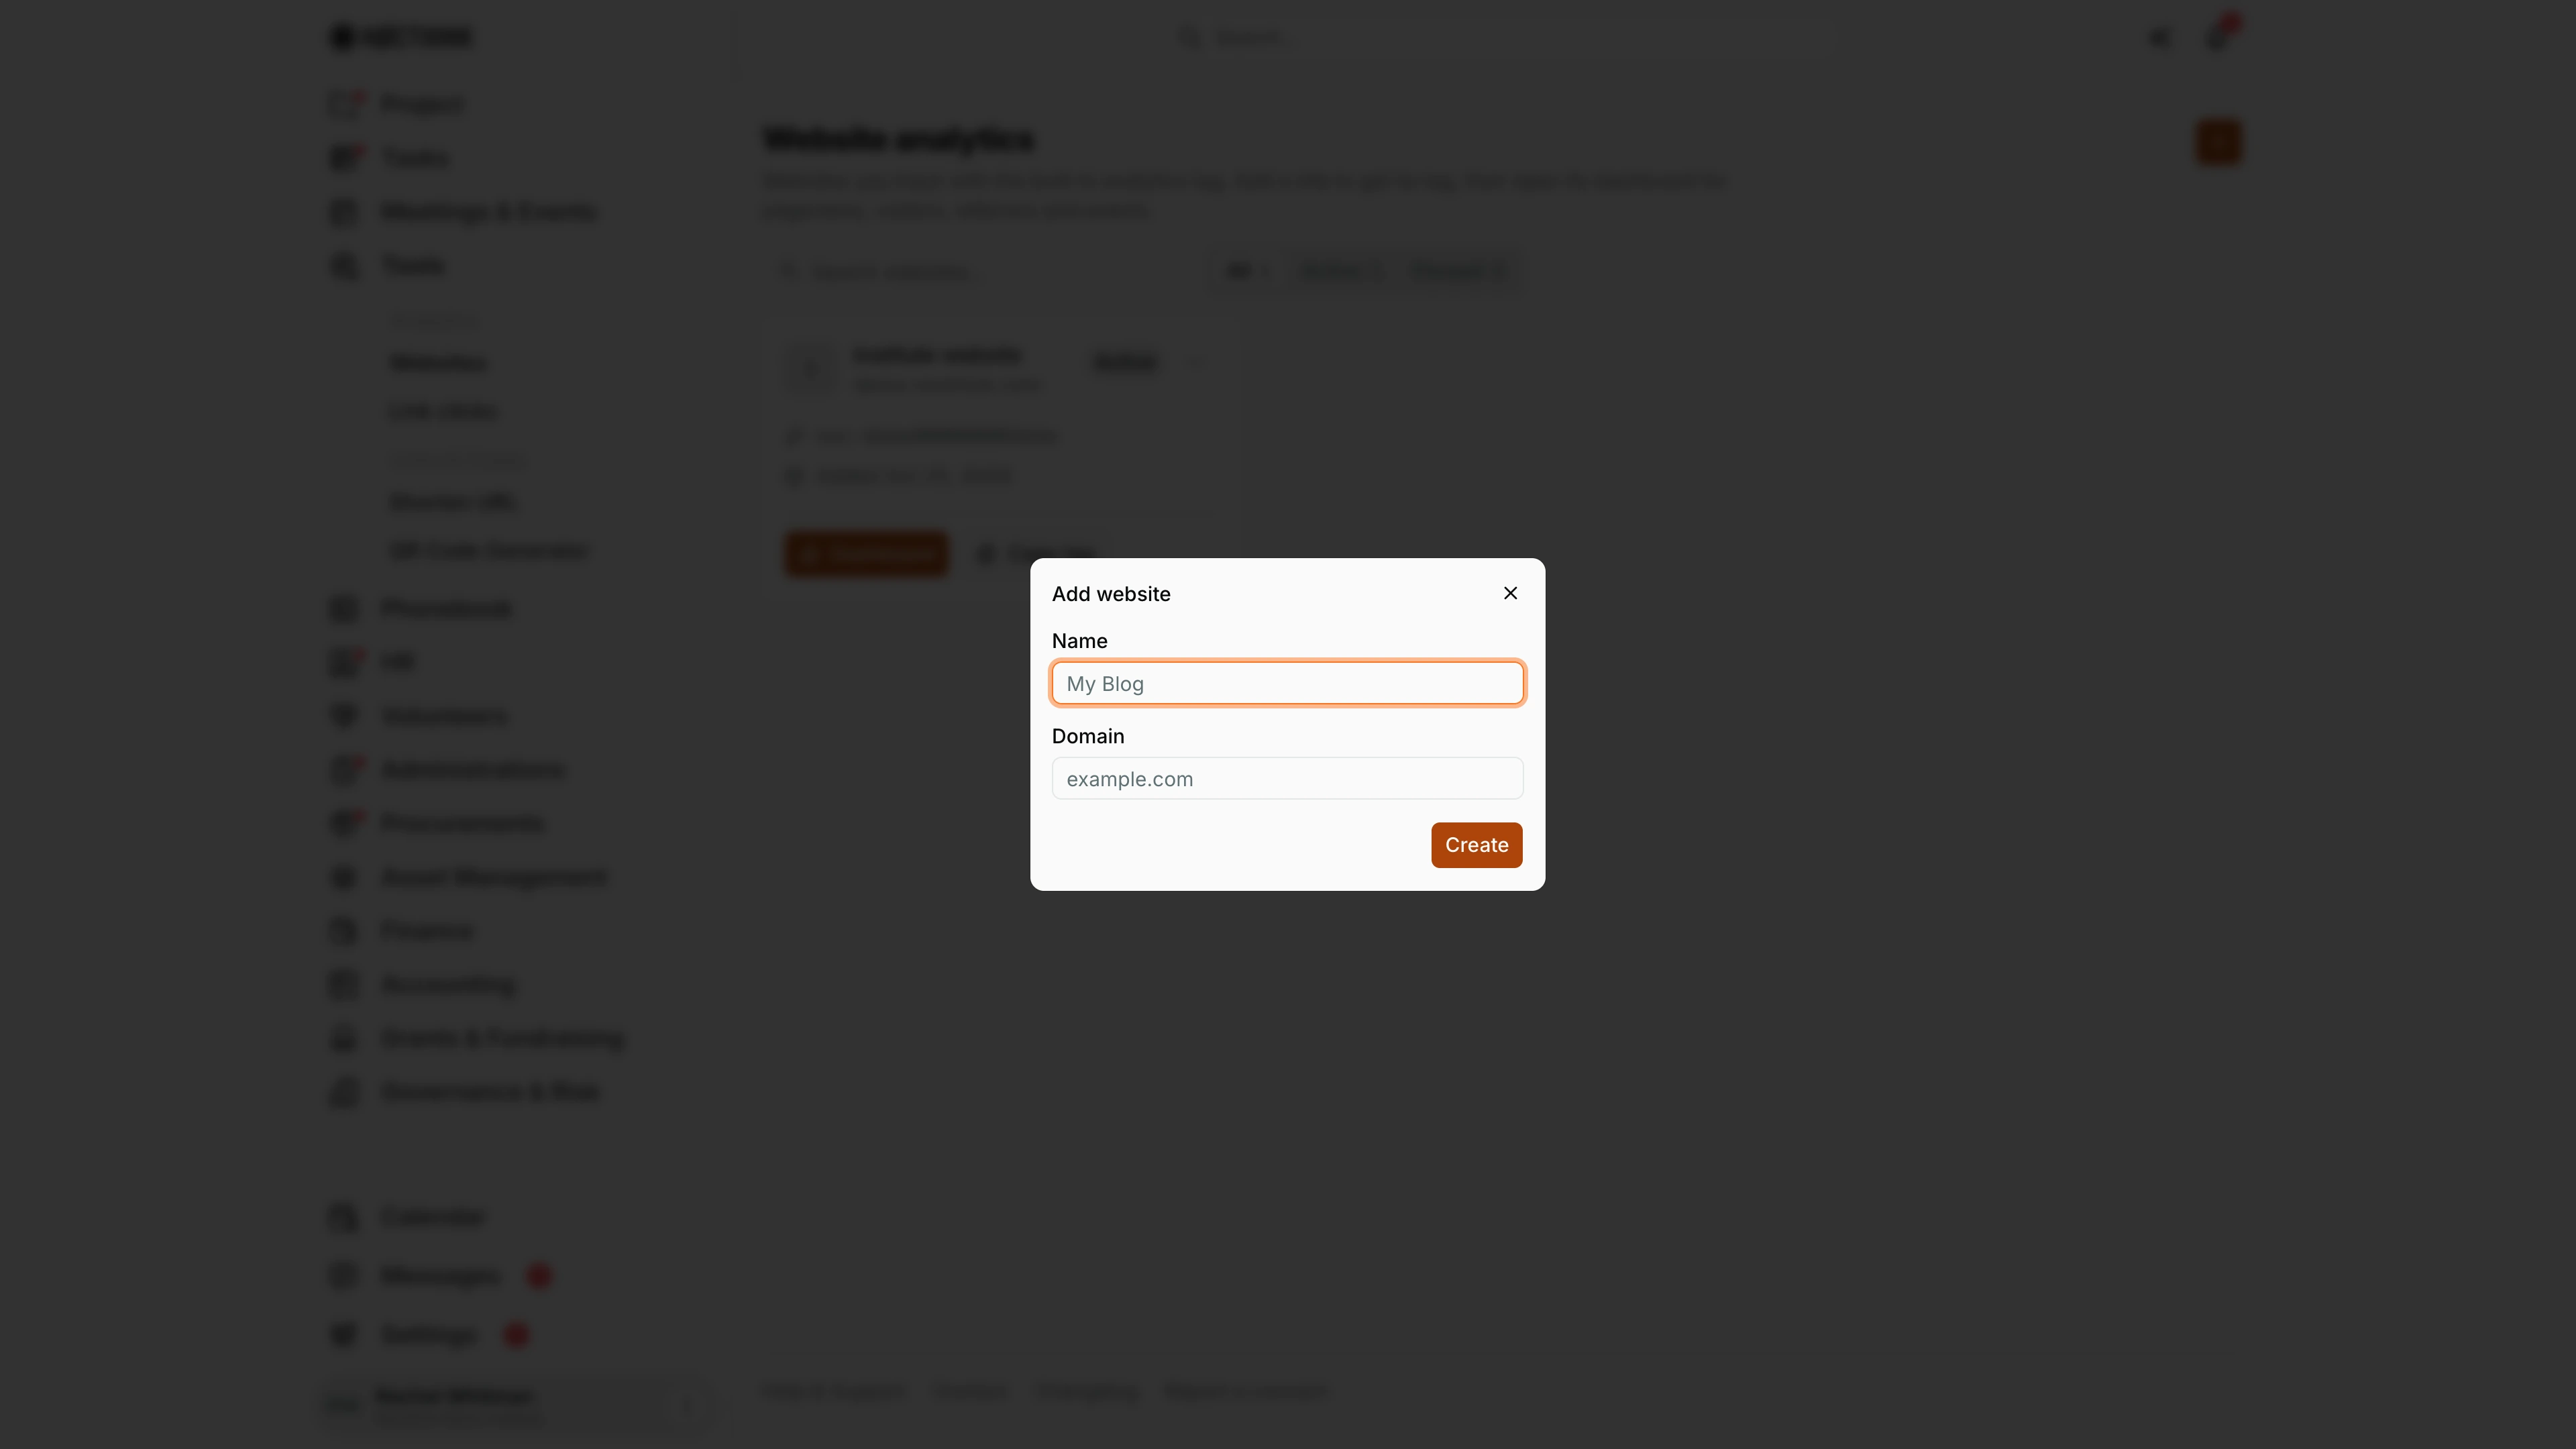
Screenshot: Rachel Whitman (Executive Director, organization owner), Nocthink Demo Institute demo data.
The orange + (Add website) at the top of the list opens this dialog. It has two fields. Name is how the site appears on its card and dashboard (placeholder "My Blog"). Domain is the bare hostname the tag will report from (placeholder "example.com"); a scheme such as https:// or a path is rejected, because collection matches on the hostname. Create saves the site, closes the dialog and adds a new Active card with its public key. If the server refuses the site, the reason appears at the top of the form and the dialog stays open. Adding a site needs analytics.create; read-only holders get a permission error. Next I copy the tag and give it to the developer (see Site dashboard: Install above).
Access & permissions
- The sidebar group Analytics and the route
/analyticsrequireanalytics.view. Staff without it neither see the menu nor can open the URL. - On the server, listing and viewing need
analytics.view; adding a site needsanalytics.create; refreshing metadata needsanalytics.update; deleting needsanalytics.delete. Read-only holders (General Affairs per docs/role.md) get a permission error on those actions. - Sites belong to the organization; everyone with access sees all of them, not just the ones they added.
Caveats
- Domain is validated: it must look like
example.com. A scheme or path is rejected, because the tag matches on the hostname. - Delete site is permanent and removes all collected data for that site; there is no undo.
- Collection only runs while the site is Active; hits for a paused site are dropped.
- The reporting period opens on the organization default from Settings → Apps → Analytics until I pick another one.
- Dates are shown in your browser's time zone; chart days are UTC calendar days.
- The public collection endpoint is rate-limited per visitor IP, so load tests or bots will not inflate numbers past the limit.
Limitations
- No pause/resume button on this page: the Paused filter exists, but there is no control here to change a site's status.
- No export of the stats or raw hits.
- Name and domain cannot be edited from the card; Refresh metadata only re-reads the site's title and favicon.
Related menus
- Link Clicks — clicks on our short links and event pages (as opposed to visits on our websites).
- Shorten URL — create the tracked links that feed Link Clicks.
- Analytics settings — default reporting period.
- Dashboard — the Tools landing page.