Link Clicks
Open in NocthinkModule: Tools · URL: /analytics/access-logs · Responsible role: Event Officer / communications (analytics.view) · Also used by: Owner/Director (full), General Affairs (read)
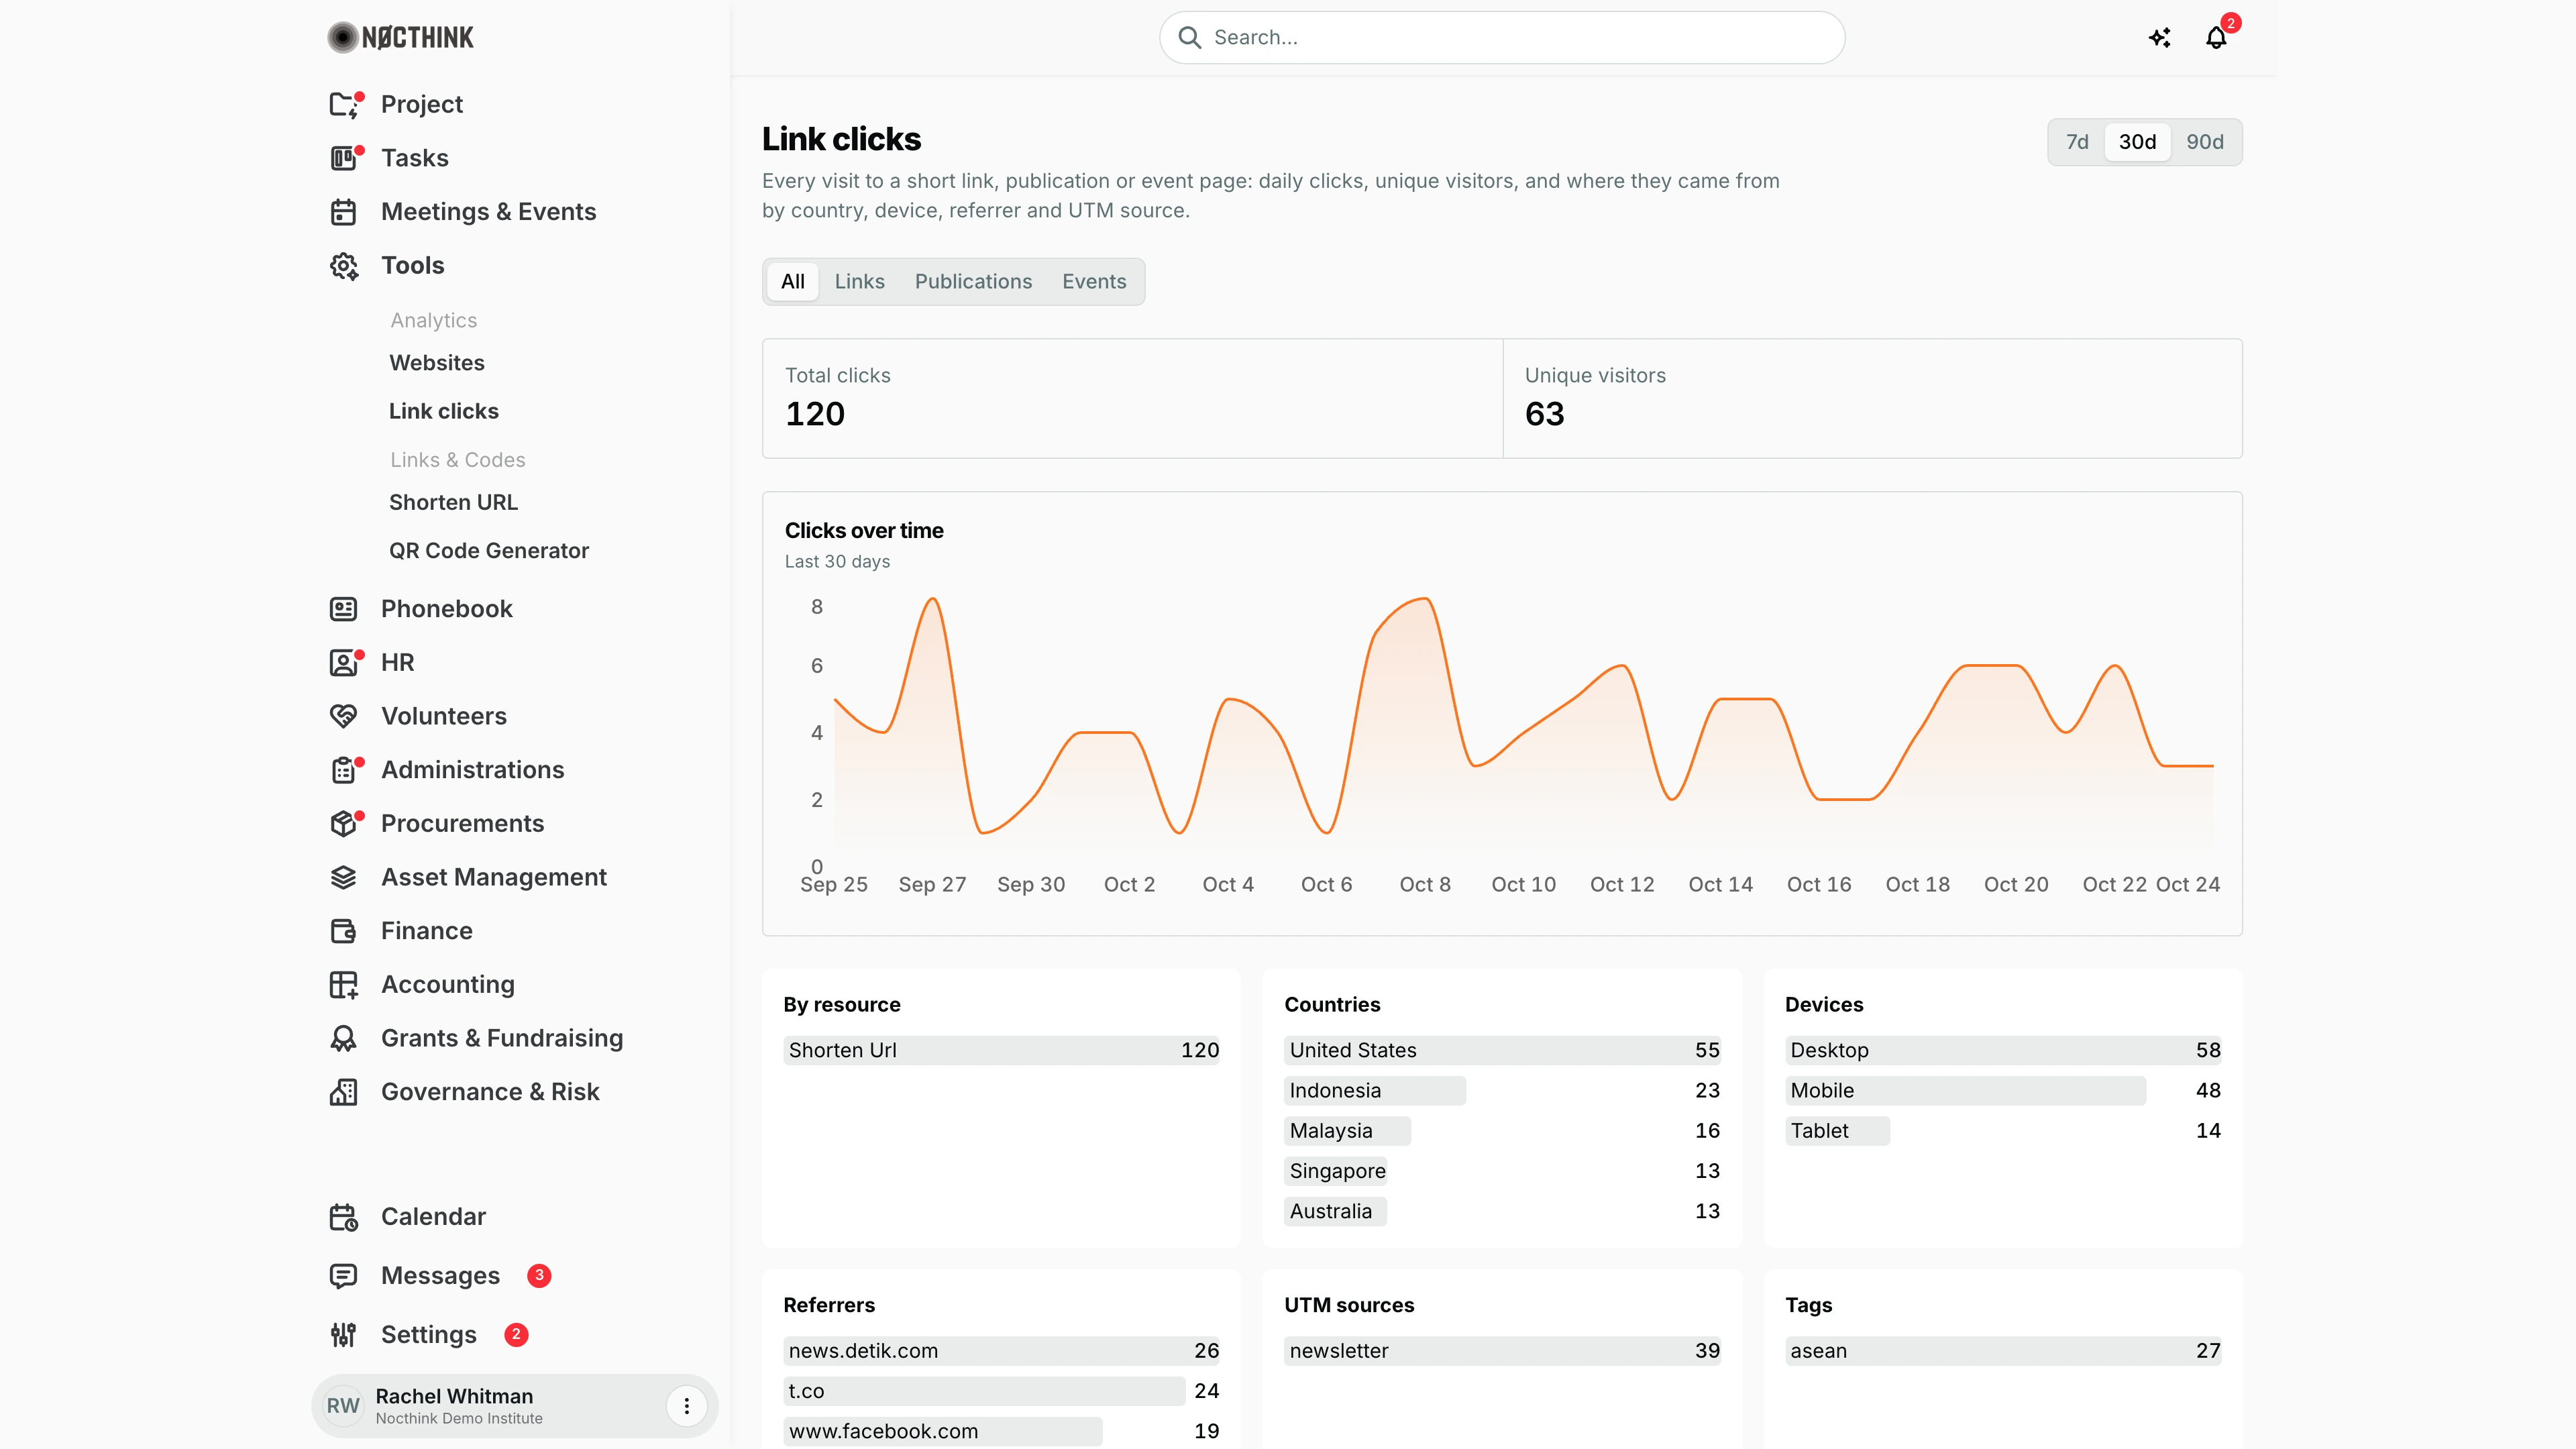
Screenshot: Rachel Whitman (Executive Director, organization owner), Nocthink Demo Institute demo data. An Event Officer sees the same page.
Why I use this page
Every time someone opens one of our public short links or an event page, a click is logged here. I use it to see, across the whole organization, which campaign links people actually used, where they came from (country, device, referrer, newsletter vs. social), and how traffic moved over the last week, month or quarter. I open it after sending a newsletter or posting an event, and when I prepare the monthly communications numbers.
What's on the screen
- Header — Link clicks with its description, and the date-range switch 7d / 30d / 90d at the top right (30d by default).
- Resource type switch — All, Links, Publications, Events.
- Stat cards — Total clicks and Unique visitors for the selected range and type (120 and 63 in the screenshot).
- Clicks over time — area chart of daily clicks, summary "Last N days".
- Breakdown panels — By resource (e.g. Shorten Url 120), Countries (United States 55, then Indonesia, Malaysia, Singapore, Australia), Devices (Desktop 58, Mobile 48, Tablet 14), Referrers (news.detik.com 26, t.co 24, …), UTM sources (newsletter 39), Tags (asean 27). Each lists the top values with a count bar. Resource types and devices are capitalized; referrer hosts, UTM sources and tags are shown exactly as recorded (e.g. "www.google.com").
- Recent clicks (below the fold) — table with When, Resource (the link slug or resource type), Path, Country, Device, Referrer ("Direct" when none), 50 rows per page, with Page X of Y and previous/next buttons.
How I …
Check how a campaign performed
- Pick the range that covers the campaign: 7d, 30d or 90d.
- Click Links to limit the view to short links.
- Read Total clicks and Unique visitors, then the Clicks over time chart for the spike after sending.
- In UTM sources and Referrers, compare channels (e.g. newsletter vs. www.linkedin.com).
- For one specific link's trend, open it in Shorten URL → Analytics instead; this page is the organization-wide view.
Tag links so they group together in the Tags panel
- When I share a short link, I add
?tag=<name>(or?tags=a,b) and/or the usualutm_source,utm_medium,utm_campaignparameters to the short URL. - Clicks carrying those parameters show up in Tags and UTM sources here.
Look at individual clicks
- Scroll to Recent clicks.
- Read the newest clicks first; use the arrows at the bottom right to page back.
- Hover a truncated Path or Referrer to see the full value.
Compare event-page traffic with link traffic
- Click Events to see only event detail views, then Links for short links.
- Use All to see the combined total and the split in By resource.
Access & permissions
- The page sits in the Tools sidebar under Analytics, which needs
analytics.view; the route/analytics/access-logsis gated the same way. The server also checksanalytics.viewfor every list and stats request. - Data is scoped to my organization: clicks are attributed to the organization that owns the short link or event.
- It is read-only for everyone, including the Owner.
Caveats
- Unique visitors is an approximation: visitors are identified by a hash of IP and browser, so the same person on two devices counts twice and a shared office IP may count once.
- Only public short-link redirects and event detail views are logged, and only successful GET requests. Both the short links copied from Shorten URL (
/s/<code>) and the legacy path/api/urls/<code>/are logged; the Path column shows which one was used. Views recorded before this was fixed only include the legacy path, so older totals here can be lower than the link's own click count in Shorten URL. - Logging is rate-limited per client IP (60 rows per 10 minutes) so bots cannot flood the counts; very heavy real traffic from one IP is undercounted.
- Click rows older than 180 days are purged automatically, so the 90d view is the longest reliable window.
- Times in Recent clicks are shown in your browser's time zone; chart days are UTC calendar days.
- Tags are capped at 10 per click and 64 characters each.
Limitations
- Publications is offered as a filter, but the server currently logs only short links and events, so it shows no data.
- No custom date range (only 7/30/90 days), no export, and no drill-down from a panel value into the table.
- No per-link filter here; per-link analytics live on the link's page in Shorten URL.
Related menus
- Shorten URL — creates the links whose clicks appear here, with per-link analytics.
- Websites Analytics — visits on our own websites via the tracking tag.
- All Events — event pages whose views are counted under Events.
- QR Code Generator — put a short link in a QR code so poster scans are counted here.