
Report
Open in NocthinkModule: Meetings & Events · URL: /events/report · Responsible role: Event Officer · Also used by: Owner/Director (full), Project Manager (read)
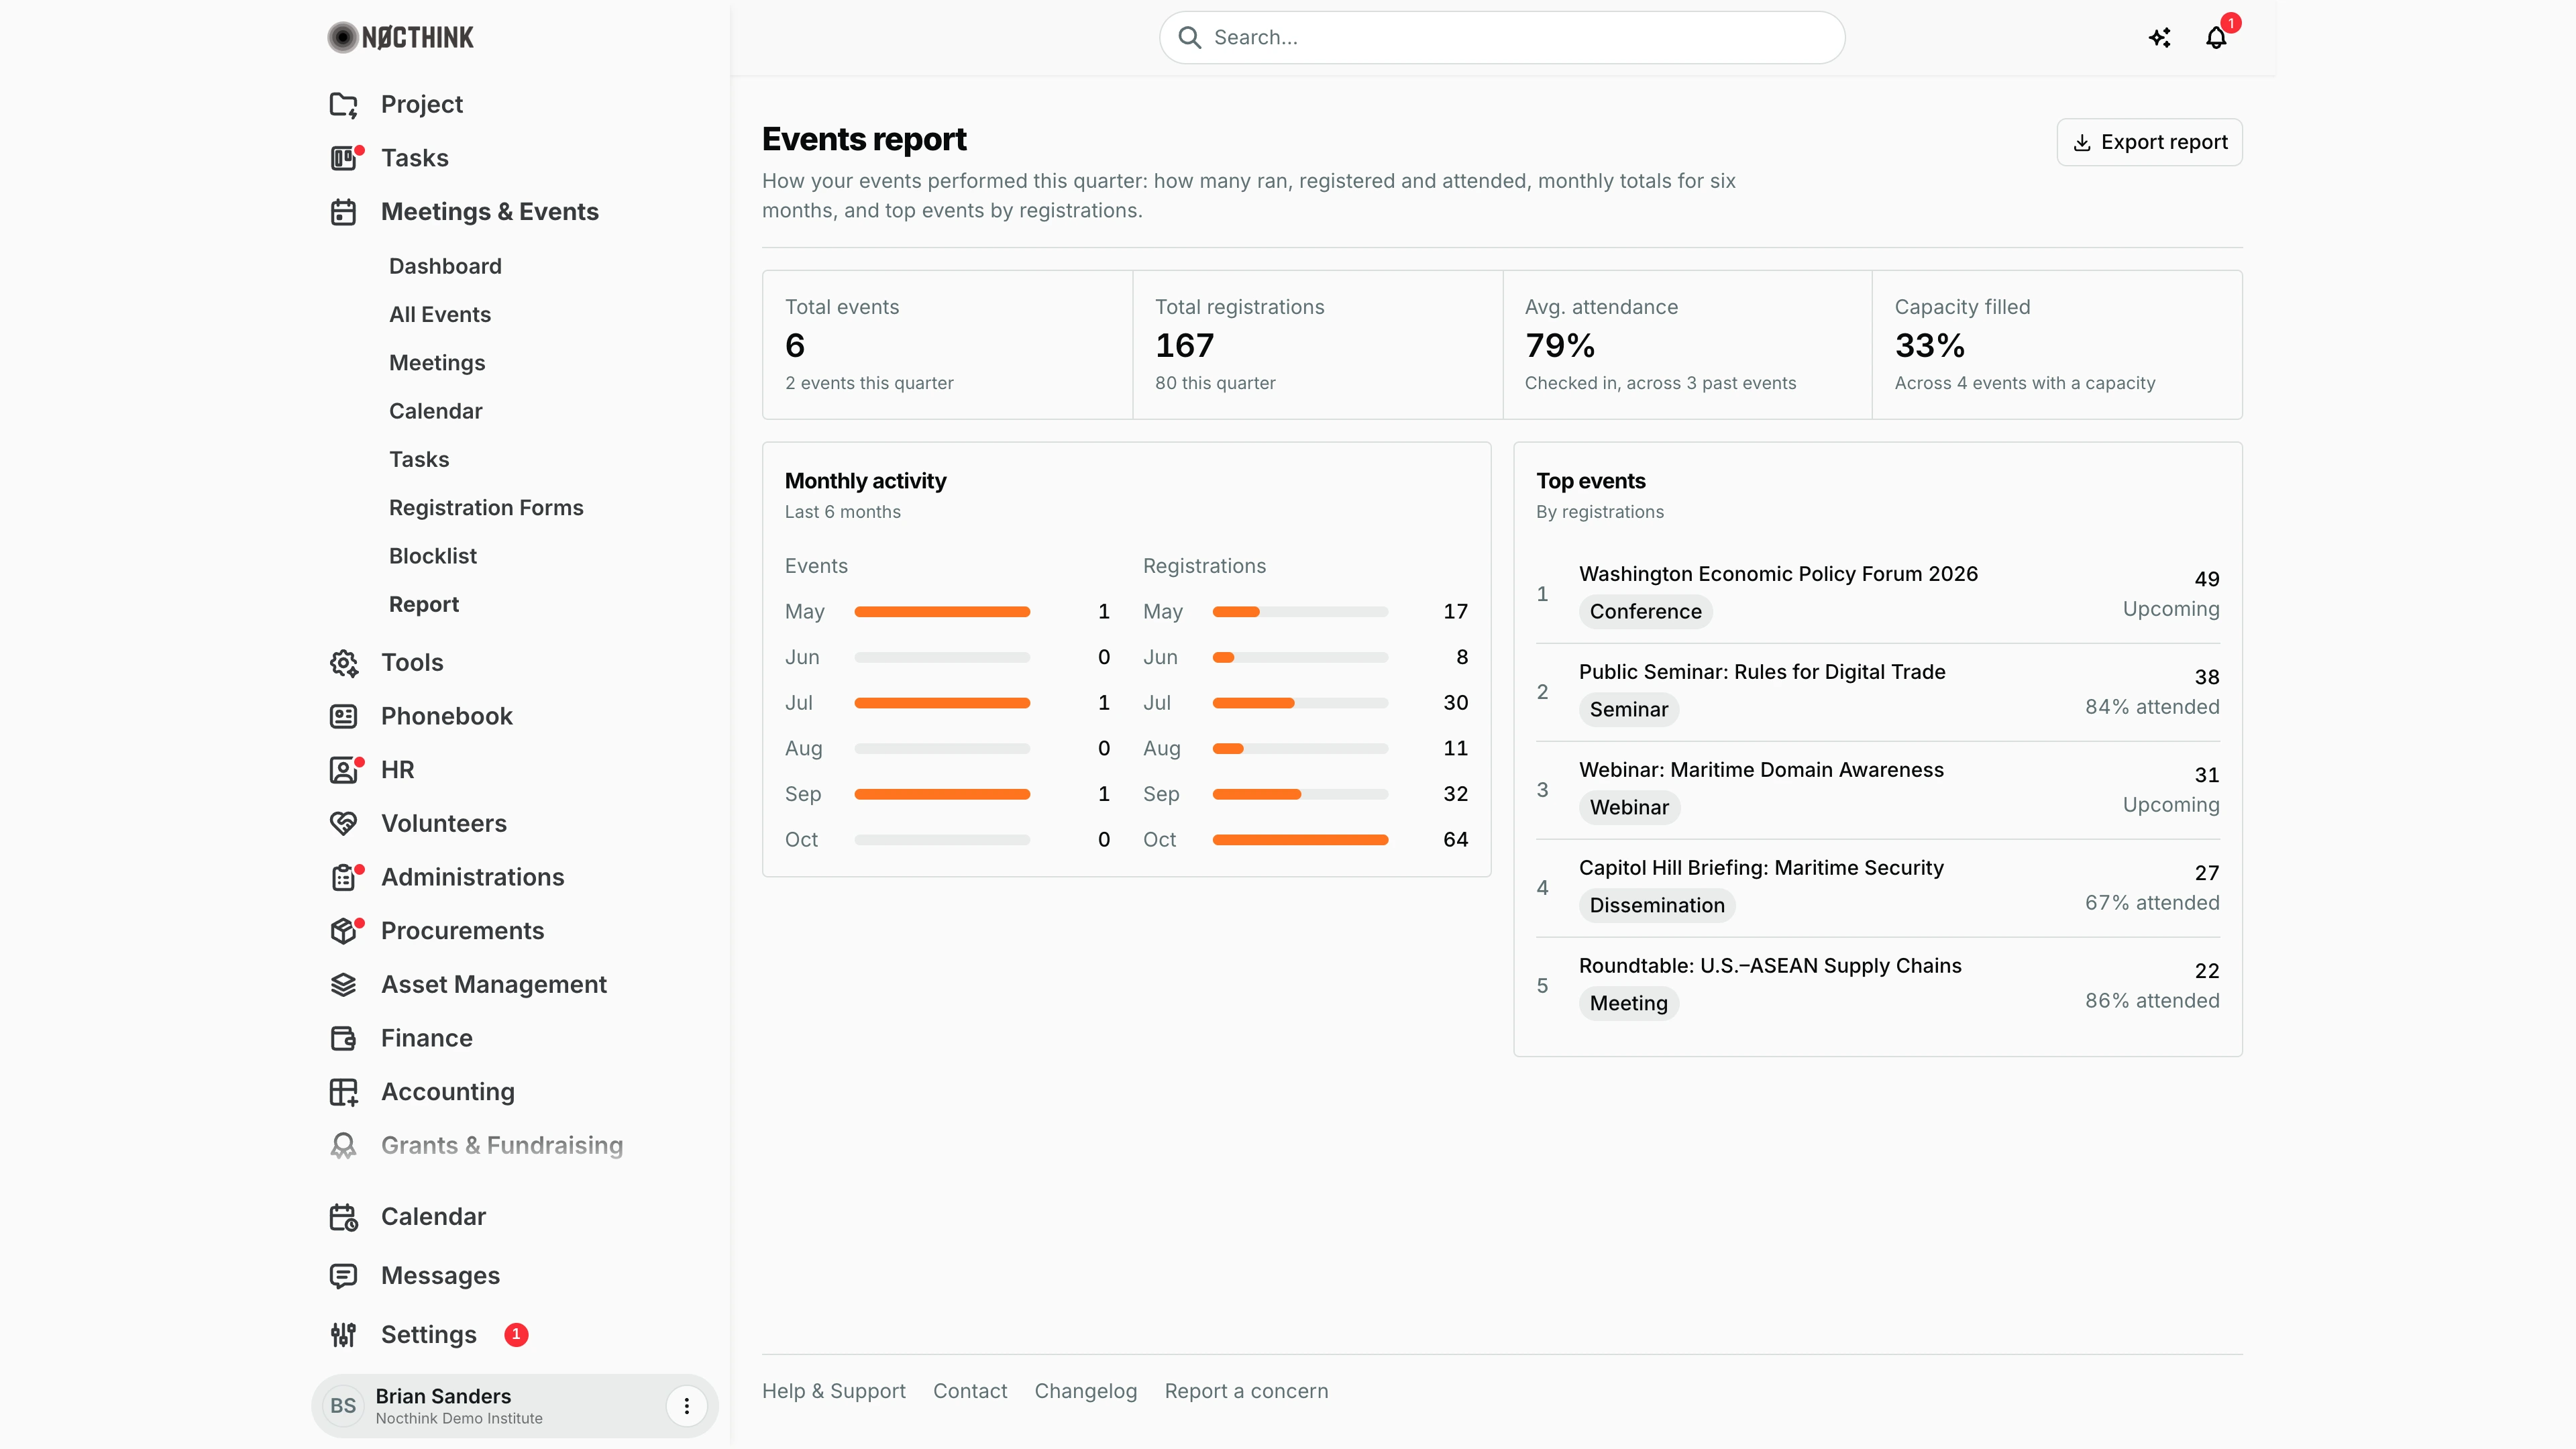
Screenshot: Brian Sanders (Deputy Director), Nocthink Demo Institute demo data.
Why I use this page
At the end of each quarter, and after every major event, I use this report to show how our events performed: how many ran, how many people registered, how many actually checked in, and how full we got against capacity. I export the CSV for the quarterly board pack and for donor reporting on project-funded events.
What's on the screen
- Header — title Events report, description and an Export report button.
- Stat cards:
- Total events — events that are not cancelled, with "N events this quarter" (events starting in the current calendar quarter). Clicking it opens All Events.
- Total registrations — the sum of each event's registrations, with "N this quarter" (registrations for the events that start this quarter, whenever people signed up).
- Avg. attendance — checked-in registrants divided by registrations, over past events that had registrations ("Checked in, across N past events"). Shows "—" when no past event qualifies.
- Capacity filled — registrations divided by capacity, over events that have a capacity ("Across N events with a capacity").
- Monthly activity (Last 6 months) — two bar lists, one row per month: Events (by start month) and Registrations (by the month people registered).
- Top events (By registrations) — up to five events that have at least one registration, ranked by registrations, each with its category pill and either "N% attended" (past events) or Upcoming. The event name links to the event workspace.
How I …
How I prepare the quarterly numbers
- Open Meetings & Events → Report.
- Read the "this quarter" notes under Total events and Total registrations (quarter = calendar quarter of today's date).
- Note Avg. attendance and Capacity filled.
- Check Monthly activity for the trend across the last six months.
How I export the data
- Click Export report (disabled when there are no events).
- A CSV named
events-report-YYYY-MM-DDdownloads with one row per non-cancelled event: Event, Type, Status, Start, Capacity, Registrations, Checked in. - Filter or pivot it in a spreadsheet for the period I need.
How I make the attendance figure accurate
- After an event, open it from Top events or All Events.
- In its Registrations tab, make sure every attendee who came is marked Checked In (or use Registration Desk on the day).
- Return to the report; Avg. attendance and the event's "N% attended" update.
Access & permissions
- Requires
events.updateorproject.approve(lib/domain-routes.ts). Per docs/role.md §4.1: Owner/Director and Event Officer (full), Project Manager (read). Other staff do not see the menu. - The report covers every event in the organization.
Caveats
- Cancelled events are excluded from every figure and from the export.
- Registrations are the event's own registration records (Registrations tab), not registration form responses. In the demo, the forum shows 49 registrations here while its form has 0 responses.
- Avg. attendance only counts events whose start date is in the past and that have at least one registration; upcoming events never lower it.
- Capacity filled uses each event's Expected Attendees as capacity; events without one are ignored. A low percentage often just means capacity was set generously.
- Quarters and the Events months are based on each event's start date in my browser's time zone; a multi-day event counts only in the month it starts. Registrations months use each registration's date, so sign-ups for next month's event show in the month they came in — which is why October's 64 registrations in Monthly activity differ from the 80 "this quarter" (counted by event start).
- Monthly activity always covers the current month and the five before it; events scheduled later (e.g. next month) do not appear there yet.
Limitations
- No date-range, category or project filter; the quarter and six-month windows are fixed.
- No meeting statistics on this page.
- The export includes every non-cancelled event regardless of date — filter by Start yourself.
- No charts in the export; it is a flat CSV.
Related menus
- Dashboard — upcoming events, attendee totals and category mix.
- All Events — registrations and check-in per event.
- Registration Forms — sign-up responses (counted separately).