
Dashboard
Open in NocthinkModule: Project · URL: /project/dashboard · Responsible role: Project Manager · Also used by: Owner/Director (full), Staff and other operational roles (self/read for their projects), Finance Staff, Finance Manager, F.A.T. Manager and Accounting Staff (read)
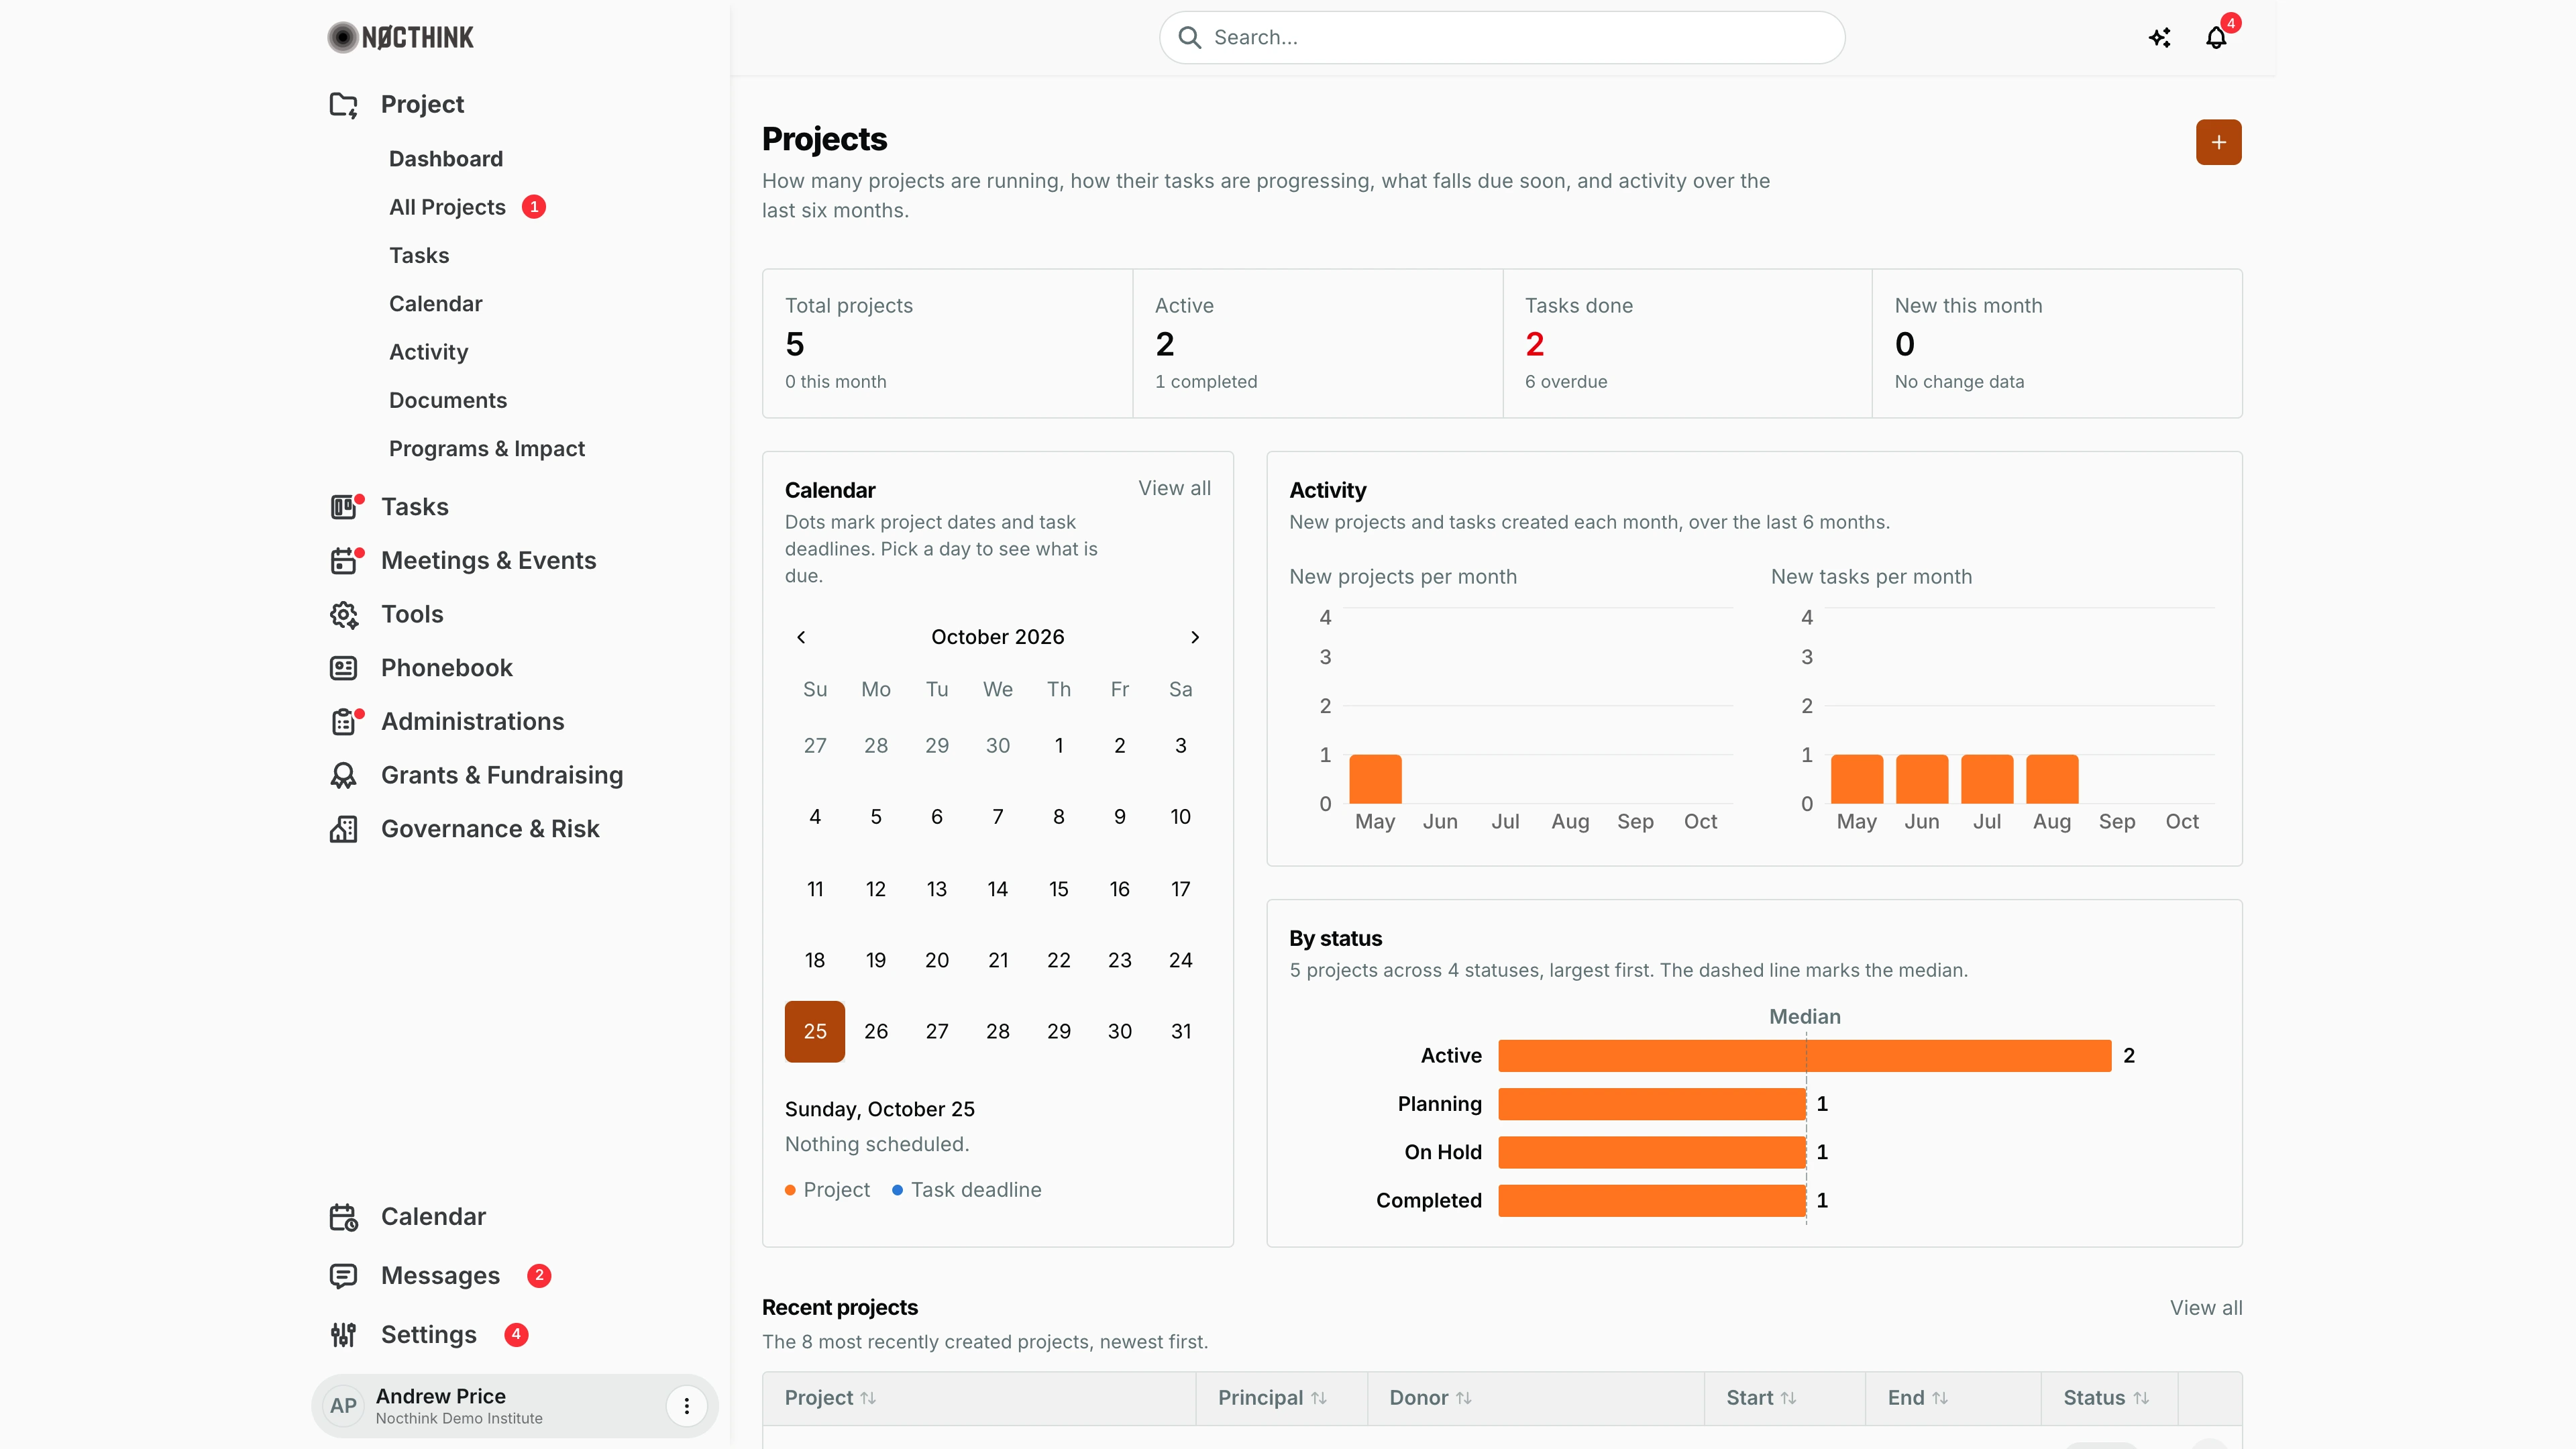
Screenshot: Andrew Price (Senior Researcher), Nocthink Demo Institute demo data. The page looks the same for a Project Manager.
Why I use this page
As Project Manager I open this page at the start of each week to see the whole portfolio in one place: how many projects are running, how project tasks are progressing, what starts, ends or falls due this month, and how much new work came in over the last six months. It tells me where to dig in, and every number links on to All Projects or the project itself.
What's on the screen
-
Header — Projects, with the line "How many projects are running, how their tasks are progressing, what falls due soon, and activity over the last six months." The orange + button at the top right (labelled Go to all projects) opens All Projects; new projects are created from there.
-
KPI strip:
- Total projects, with "n this month".
- Active, with "n completed".
- Tasks done, with "n overdue". The value turns red when any project task is overdue.
- New this month, with "Up/Down n% vs last month", or "No change data" when last month had none.
The first two cards link to All Projects.
-
Calendar — a month picker. Orange dots mark project start/end dates and blue dots mark task deadlines (legend: Project, Task deadline). Picking a day lists its entries ("Project start", "Project end", "Task due", with the project name), or "Nothing scheduled." View all opens the Project Calendar.
-
Activity — two bar charts, New projects per month and New tasks per month, covering the last 6 months.
-
By status — a ranked bar chart of projects per status (for example Active, Planning, On Hold, Completed). The dashed line marks the median.
-
Recent projects — "The 8 most recently created projects, newest first." The columns are Project, Principal, Donor, Start, End and Status, all sortable (click a header to cycle asc / desc / off). View all opens All Projects. The row ⋯ menu has Open project, Tasks and Settings.
How I …
Run my weekly portfolio check
- Open Project → Dashboard.
- Read the KPI strip. If Tasks done is red, note the overdue count.
- Go to Tasks to find the overdue items and chase their assignees.
- Check By status for projects sitting in On Hold or Planning longer than expected.
See what lands this month
- In Calendar, look for days with dots.
- Click a day. The list underneath shows projects starting or ending that day and task deadlines, with the project name.
- Click View all for the full project calendar.
Jump into a recent project
- In Recent projects, click a header (for example End) to sort.
- Click the project name, or use ⋯ → Open project.
- Use ⋯ → Tasks to go straight to its task board, or ⋯ → Settings to change its details, team or status (editing depends on my project role).
Start a new project
- Click + in the header. It opens All Projects.
- Create the project there (see All Projects).
Access & permissions
The menu needs project.view (Project section). The KPIs, charts and the Recent projects list are computed across all projects in the organization, not only mine. Opening a project and acting inside it is controlled by my project role on that project's team (Owner / Manager / Member / Viewer, or custom roles), which grants view/create/edit/delete per project module. Fund details are masked for people who are not team members and lack finance authority. Owner/Director bypass the project-role checks.
Caveats
- Counts are organization-wide: a Staff member sees the same totals as the director, even for projects they are not on.
- "Overdue" counts project tasks with status To do, In progress or Review whose due date has passed. Tasks without a project are excluded.
- New this month and the monthly charts use the record's creation date (UTC month), not the project start date.
- Projects that are On Hold, Completed or Archived are read-only. Their records cannot be changed until the status is moved back.
- If any of the three data sources fails, a red "Failed to load dashboard data. Please try again." banner appears above the page.
Limitations
- No filters (by department, donor or principal) and no date-range selector. The charts are fixed to 6 months.
- No export of the KPIs or charts.
- Recent projects shows only the 8 newest. Use All Projects for search and paging.
- The + button does not open a create form directly.
Related menus
- All Projects — full list, search and project creation.
- Tasks — cross-project task board behind the overdue count.
- Calendar — full project calendar (View all).
- Activity — the log of what changed in my projects.
- Funds & Grants — funding behind the Donor column.
- Programs & Impact — results and indicators per program.